How to run an accurate A/B test experiment?
In today's dynamic startup environment, data-driven decisions are more crucial than ever. Every change to a product, website, or campaign carries potential outcomes, and the ability to measure and understand these outcomes can set the trajectory for success. This is where A/B testing steps in as an invaluable tool.
A/B testing allows startups and established businesses alike to compare variations of their digital products and marketing strategies to see which one resonates best with their audience. It's a methodical approach that minimizes guesswork and leverages real user data to inform decisions.
While A/B testing serves as a beacon for informed decisions, it's imperative to tread with caution. When not executed meticulously, A/B tests can provide misleading results, which in turn can lead to ill-advised business choices. The precision and validity of experiment setup, traffic allocation, and interpretation are paramount. A flawed test can easily give a false sense of direction, driving businesses down a path based on inaccurate data.
With platforms like Tggl streamlining the A/B testing process, implementing and interpreting tests has become more straightforward. In this guide, we will delve deep into the world of A/B testing, focusing on its core concepts, the significance of accurate traffic splitting, and the best practices to achieve reliable results.
What is an A/B test?
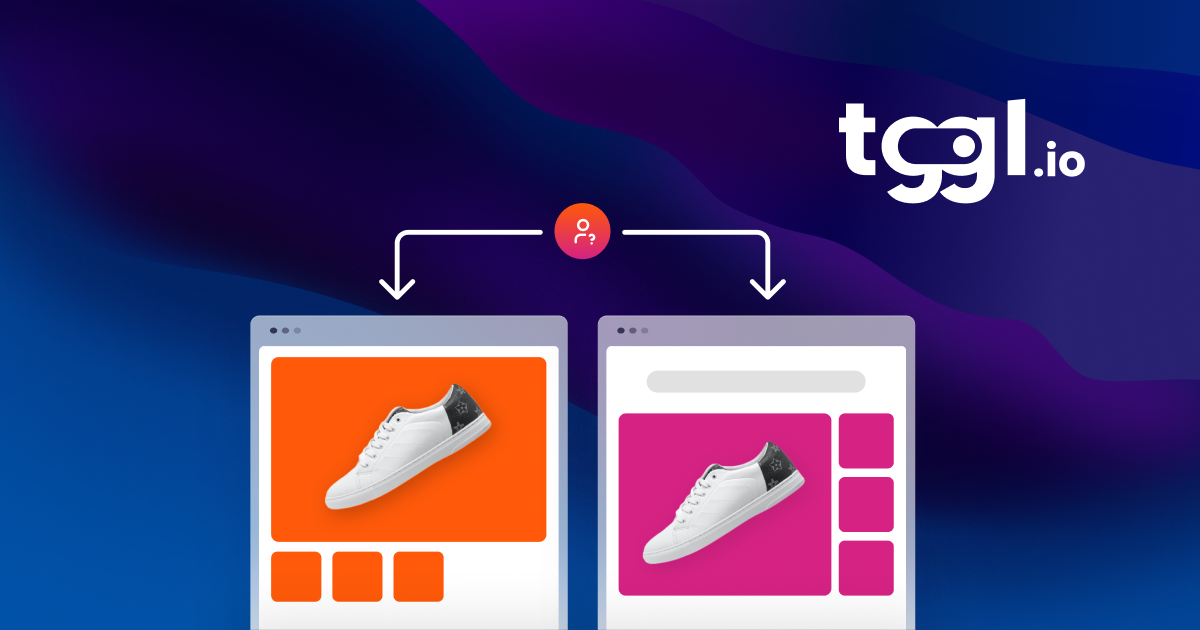
At its essence, A/B testing is a comparative method used in the digital realm to determine the effectiveness of specific changes or variations. The 'A' and 'B' in the name denote two different versions being tested against each other. The primary goal is to identify which version yields better performance concerning a predefined metric or objective. Here's a closer look:
-
Definition of metrics: Before initiating the test, it's essential to define what you're measuring. Are you looking to improve click-through rates, increase the time users spend on a page, boost conversions, or some other metric? Pinpointing the exact goal keeps the test focused and relevant.
-
Variation creation: Once the metric is defined, you'll create a variation (or 'B' version) of your original content (the 'A' version). This variation can range from a changed call-to-action button, different webpage layouts, modified ad copy, or even an entirely new feature in an app.
-
Randomized distribution: Users are then randomly assigned to either the 'A' group or the 'B' group. This ensures a balanced distribution and that external factors don't skew the results. Platforms like Tggl can facilitate this distribution, ensuring randomness and stickiness, so users consistently see the same version throughout the test.
-
Data collection & analysis: As users interact with the A or B version, data is collected. After a sufficient amount of data is gathered, you'll analyze it to see which version met or exceeded the predefined metric. For instance, if the goal was to increase sign-ups, you'd compare the sign-up rates between the two versions.
With Tggl, you can analyse the results of your experiment directly within your preferred analytics tool. To learn more about some of our integrations with tools like Amplitude, you can check out this article.
- Implementation: Based on the results, you can confidently implement the more effective version. If the 'B' version outperforms 'A', you might choose to make 'B' the new standard. Alternatively, insights gained might inspire a new test with a different variation.
A/B testing might seem straightforward, but its strength lies in its simplicity. By providing a structured approach to making changes, it ensures decisions are rooted in actual user behaviour, making it a staple in the toolkits of developers, product managers, marketers, and entrepreneurs.
A/B testing across sectors
At first glance, A/B testing might seem tailor-made for the B2C sector. With its vast audiences, e-commerce sites, apps, and other digital platforms, B2C businesses often generate a wealth of data ripe for A/B testing. Such ample data allows companies to detect even minor variations in performance, making A/B testing a favourite tool for B2C digital marketers.
However, the application of A/B testing is not limited to just B2C businesses. While B2B businesses might face challenges due to smaller sample sizes, there are still valid reasons and methods to employ A/B testing in a B2B context. Here's why and how:
-
High-value decisions: In the B2B world, each decision often carries significant financial weight. Making a wrong decision based on gut feeling can be costly. A/B testing provides empirical data to guide decisions, ensuring that even minor tweaks are grounded in real user feedback.
-
Segmentation and personalization: B2B buyers are looking for personalized experiences now more than ever. By using A/B tests, B2B companies can fine-tune their marketing strategies for different segments, ensuring that messaging is precise and resonates with each unique audience.
-
Longer sales cycles: The B2B buying process often involves multiple decision-makers and can stretch over weeks or even months. This longer sales cycle offers multiple touchpoints and opportunities to test various strategies and messaging.
-
Qualitative over quantitative: While B2C A/B testing often leans heavily on vast quantities of data, B2B can focus on the quality of insights. For instance, getting feedback from a key decision-maker in a target company can be more valuable than hundreds of data points from less relevant sources.
-
Innovative test design: Since B2B companies may not have the vast traffic that B2C sites enjoy, they need to be more innovative in their test designs. This might include longer test durations, or tests focused on high-impact pages.
In conclusion, while B2C sectors might have the advantage of volume, B2B sectors bring depth and quality to the table. With the right approach and tools, A/B testing can be just as effective, if not more so, in a B2B context.
Steps to conduct an A/B test
Embarking on an A/B testing journey requires a structured approach. Here's a step-by-step guide to ensure your A/B test experiment is both effective and informative:
-
Define your objective: Before anything else, pinpoint what you aim to achieve. It could be increasing newsletter sign-ups, enhancing user engagement on a particular feature, or boosting sales for a specific product. A clear objective will guide the entire testing process.
-
Select your variable: Decide on the single element you wish to test. This could be anything from the colour of a button, the wording of a call-to-action, or even the design of a landing page. Remember, testing one variable at a time ensures clarity in results.
-
Determine your sample size: Depending on your website's traffic or app's user base, decide on a sample size large enough to yield statistically significant results. Tools are available online to help calculate the ideal sample size based on your expected effect size and current conversion rates.
-
Split your traffic: Using a tool like Tggl, allocate your users randomly to either the control group (A) or the variant group (B). Ensure that traffic splitting adheres to principles of randomness and stickiness, so users always encounter the same version.
-
Monitor the test: Once the test is live, consistently monitor its progress. Look for any anomalies or unexpected behaviours that might skew the results.
-
Analyze the data: After the test duration concludes, gather the data and analyze the results. Did one version outperform the other? Were the results statistically significant?
With our free A/B test calculator, you can instantly see if your A/B testing results are significant & explore what happens as you adjust user volumes, conversion rates, and confidence levels!
-
Implement changes: Based on your findings, decide on the next steps. If one variant outperformed the other, consider making that change permanent. If the results are inconclusive, think about refining your test or testing another variable.
-
Iterate: A/B testing isn't a one-time process. Regularly conduct tests as your product evolves, ensuring you're always optimizing based on user feedback and behaviour.
Best practices for A/B testing
A/B testing, while a powerful technique, demands careful execution to derive accurate insights. Here are some best practices that seasoned A/B testers follow:
- Quick experiments for swift results:
-
Agility in action: Embrace short experiments to align with agile methodologies. These swift tests enable teams to glean insights, adapt, and iterate promptly.
-
Typical duration: Most experiments should run between 7 to 10 days. This timeframe strikes a balance between obtaining actionable data and maintaining a brisk pace.
- Ensuring data integrity:
-
Avoid ambiguity: Data is the bedrock of your experiment. Avoid vague data points or negligible version differences to ensure that your data forms a strong base for decision-making.
-
Robust results: Your outcomes should be unambiguous. Insignificant or unclear results can mislead and derail your optimization efforts.
- Using reliable tools for insights:
-
Informed decisions: Avoid making hasty decisions based on immature results. Employ tools like our A/B Test significance calculator to gauge the statistical significance of your experiments.
-
Meaningful metrics: Ensure your results are both meaningful and reliable. This not only improves your decision-making quality but also gives you confidence in the changes you're implementing.
-
Assessing outcomes: If your test doesn't show a significant performance difference, you're at a crossroads. Consider extending the test to gather more data or conclude the test as inconclusive. Remember, not every test will yield a clear winner, and recognizing an inconclusive result is as essential as identifying a successful change.
By following these best practices, you're better positioned to extract accurate, actionable insights from your A/B tests. A careful, informed approach can spell the difference between genuine progress and misguided steps.
Decoding traffic splitting: the backbone of reliable A/B testing
Effective A/B testing relies heavily on the precision with which we split our traffic between variations. Think of this process as the foundation of your test; if it's shaky, the entire experiment could be compromised, leading to unreliable or even misleading results. Proper traffic splitting ensures that the data collected genuinely reflects user behaviour and preferences, providing actionable insights. In contrast, a flawed approach can skew data and misguide strategies. In this section, we'll dive deep into the nuances of traffic splitting and how to optimize it for accurate A/B testing outcomes.
Pillars of traffic splitting
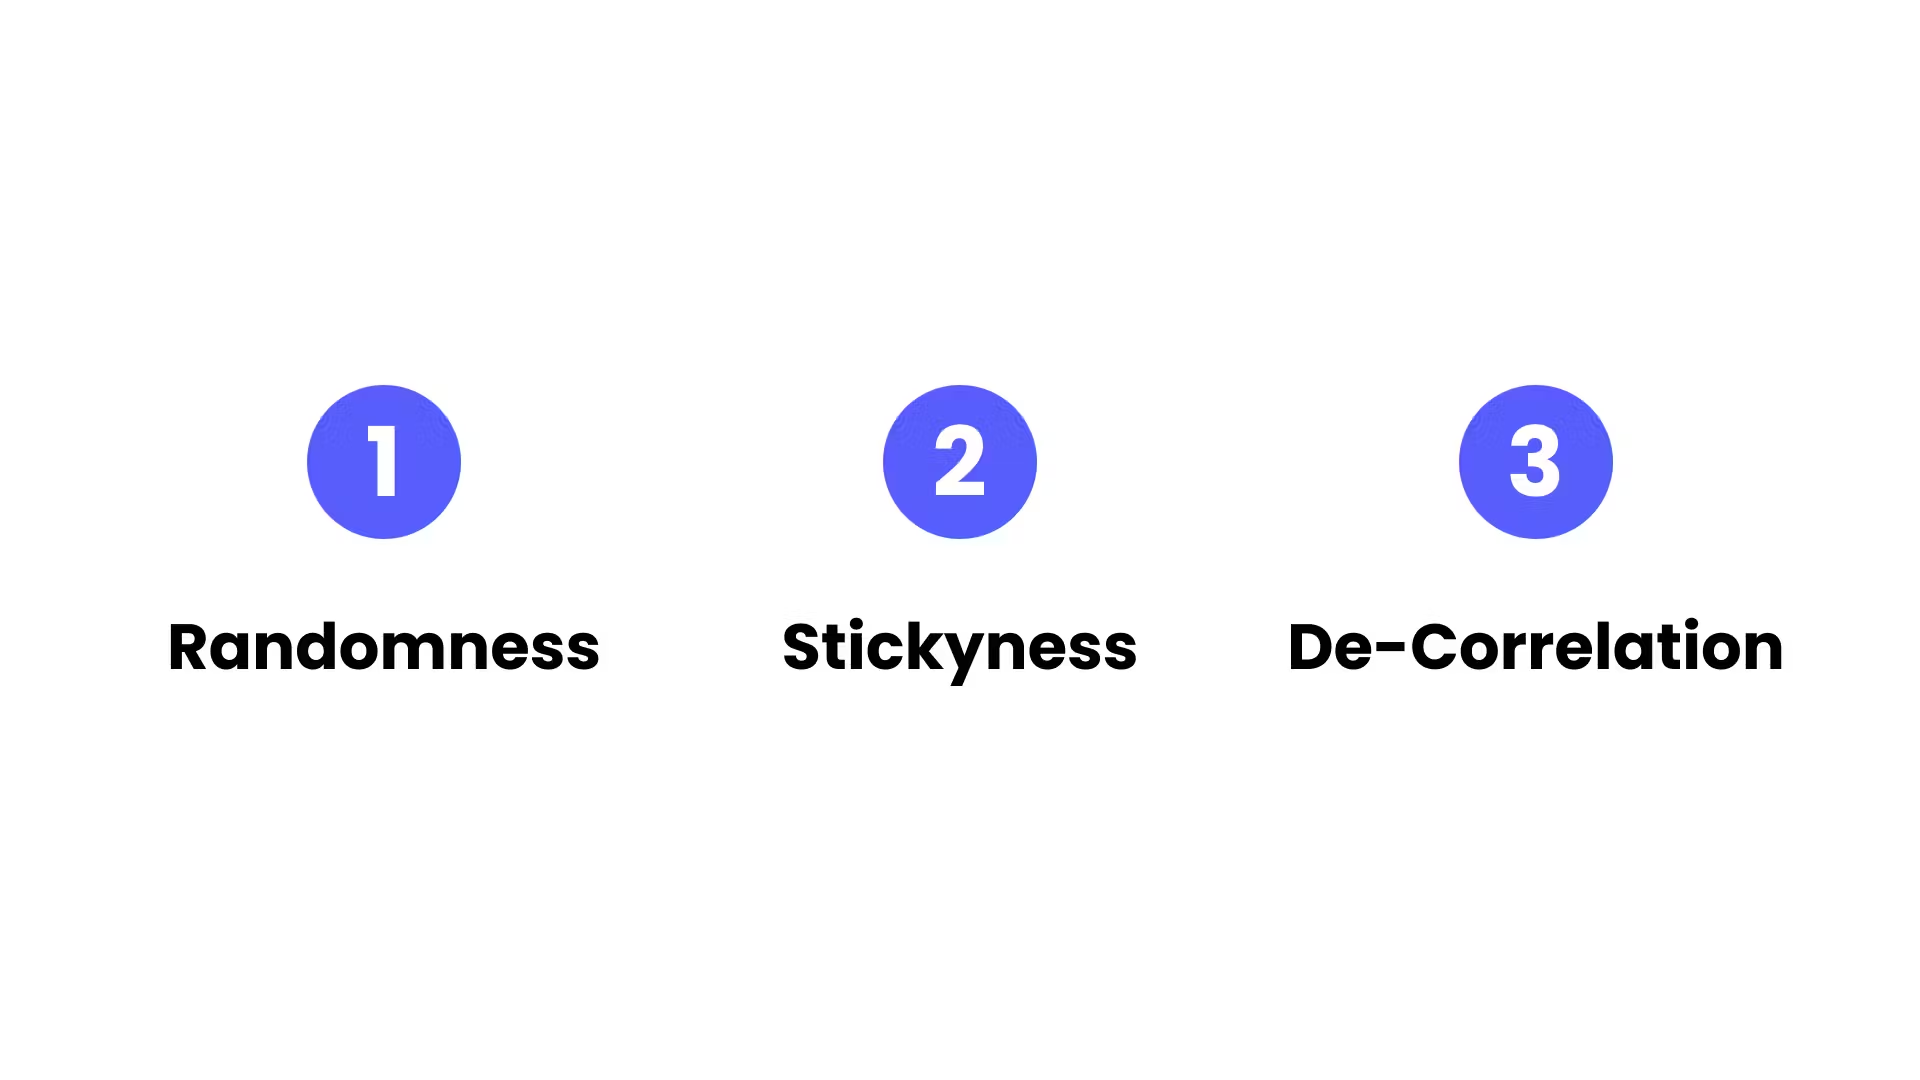
For A/B testing to yield accurate and actionable insights, how we divide the traffic between our test variations is paramount. The following are the three fundamental pillars of traffic splitting:
-
Stickiness: Stickiness ensures that once a user is assigned a particular variation (either A or B), they consistently encounter that variation throughout the test duration. It prevents any confusion that could arise from toggling between versions. Essentially, if a user starts with variation A, they should always experience variation A.
-
Randomness: The assignment of users to variations must be truly random. This means that if you're aiming for a 50/50 split between A and B, the selection mechanism should be unbiased. Randomness ensures an even distribution, so neither of the variations has an unfair advantage due to over or under-representation in any user segment.
-
De-Correlation: Running multiple A/B tests concurrently? Ensure that they don't influence one another. For instance, if a user is seeing variation A in one test, it shouldn't predetermine their experience in another concurrent test. Each experiment should be independent to maintain the integrity of the results.
These pillars serve as the foundation of any successful A/B test. They ensure that the data you collect is a true representation of user behaviour and preferences, rather than being skewed by external factors or flawed methodologies.
Naive approach
The obvious solution that comes to mind to randomly assign a variation is to roll a dice and compare it to a threshold:
if (Math.random() < 0.5) {
  // Variation A
} else {
  // Variation B
}
This solves the randomness and the de-correlation pillars: each experiment is independent. But if our user refreshes, it might see a different variation each time...
This introduces the need to store the variation attributed to the user to be able to serve the same variation every time.
user.assignedTo ??= Math.random() < 0.5 ? 'A' : 'B'

if (user.assignedTo === 'A') {
  // Variation A
} else {
  // Variation B
}
Here we store on the user the variation that was assigned to it and only compute it the first time.
What should happen if you change the threshold? This approach forces us to put some complex logic in place to re-assign users to a new variation, a better solution would be to store the random value directly:
user.assignedTo ??= Math.random()

if (user.assignedTo < 0.5) {
  // Variation A
} else {
  // Variation B
}
This way, if we change the threshold, we don't need to re-compute anything, users will automatically move to the right variation!
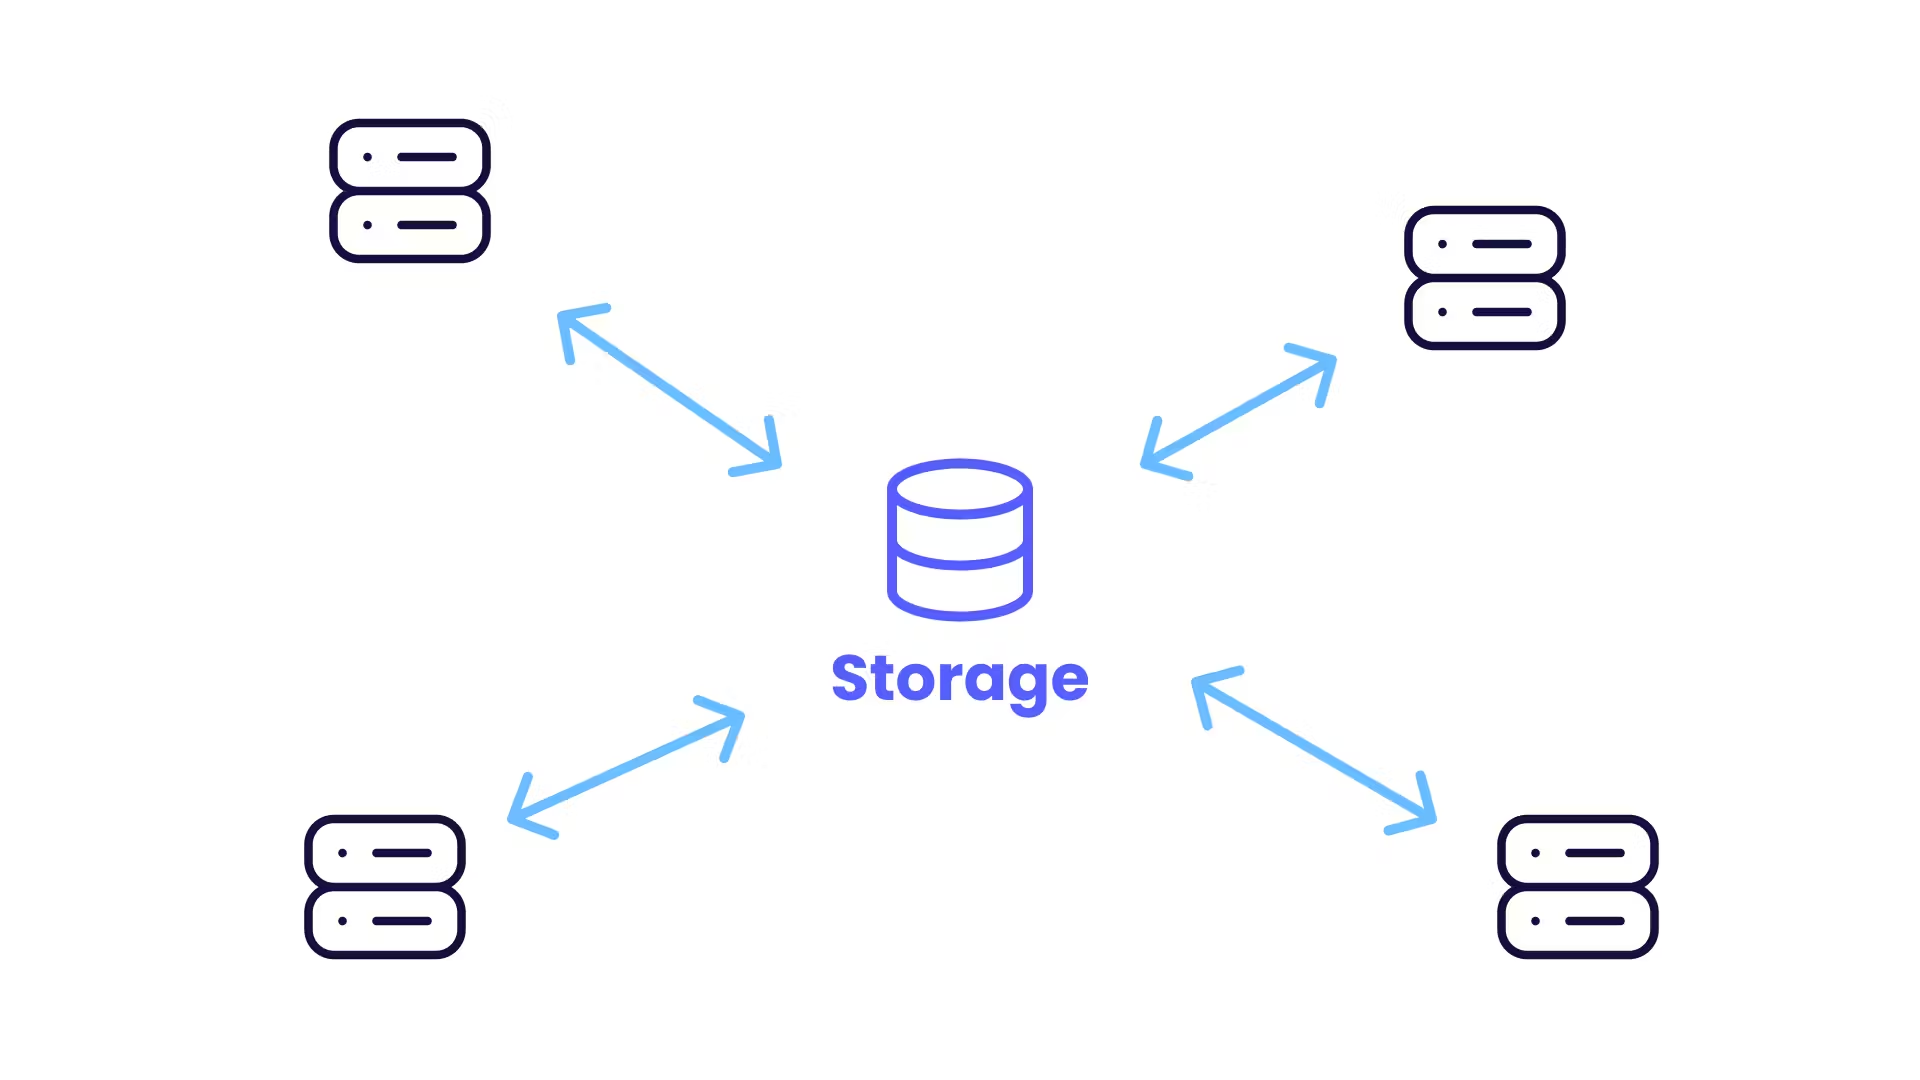
This is great, but we introduced a major problem, we would need to have a central storage that syncs everything:
-
Horizontal and distributed scaling becomes more complex
-
We would need to store
number of flags*number of usersvalues -
Subject to race conditions
-
Performance would not be great
Ideally, we would want a solution that works without a central storage, and without requiring the user to log in.
Solving stickiness
Stickiness may be a tricky thing to get right, you need to think of the entire journey of the user across which you want the variation to be sticky for your experiment. Will the user switch from their desktop to the mobile app, and should you be sticky in this situation? Are you dealing with an important part of the traffic that is not logged in? Which platform are you running your experiment on, and what data can you use to identify a user?
At its heart, stickiness is just a matter of choosing the right data to identify a user. Here are a few options that you have and in which scenarios those options can be used:
-
Simply use the user ID: This is ideal because you control this data and the user cannot change its ID. It works across devices so you can offer the same experience to your users even when they switch from their computer to their phone. The only drawback of this solution is that it only works on traffic that is logged in, if you are running an app where most traffic is organic and comes from a search engine, chances are that only a tiny portion of your traffic is logged in.
-
Using a cookie: This is literally what cookies were made for, it allows you to save a random session ID to the browser of your users that is persistent across refreshes. This has the benefit of being able to show a variation to a user who is not logged in and keep showing the same variation as long as it does not clear its cookies or change the device.
-
Using local storage: Works exactly like cookies, except that it must be handled by the frontend in JavaScript. It has an edge over cookies because users are less likely to clear their local storage, but it requires more code to get it to work.
-
Device ID: On mobile apps, you have access to a unique device ID, which can be used to identify users who are not logged in and keep showing them the same variation after they log in and switch accounts. Like cookies and local storage, its biggest drawback is that you are unable to track users across devices, but at least the user cannot change device ID.
Ditching the storage
Let's choose the user ID as the data for your stickiness, the most obvious thing to do to split traffic in half would be to run a modulo on it (assuming it is a number).
if (userId % 100 < 50) {
  // Variation A
} else {
  // Variation B
}
By doing so, all users with an ID ending in 00-49 will see variation A, and all ending in 50-99 will see variation B, which should be 50/50. Right?
Unfortunately, this is not the case. Most databases do not guarantee that an autoincrement value is uniform, it can skip values in unexpected ways, throwing off your traffic splitting.
A logical answer might be to base the split on a truly random value, like the timestamp at which the user signed up:
if (user.signedUpAt % 100 < 50) {
  // Variation A
} else {
  // Variation B
}
Unfortunately, this simple solution may lead to unexpected results as sign-up time is far from random.
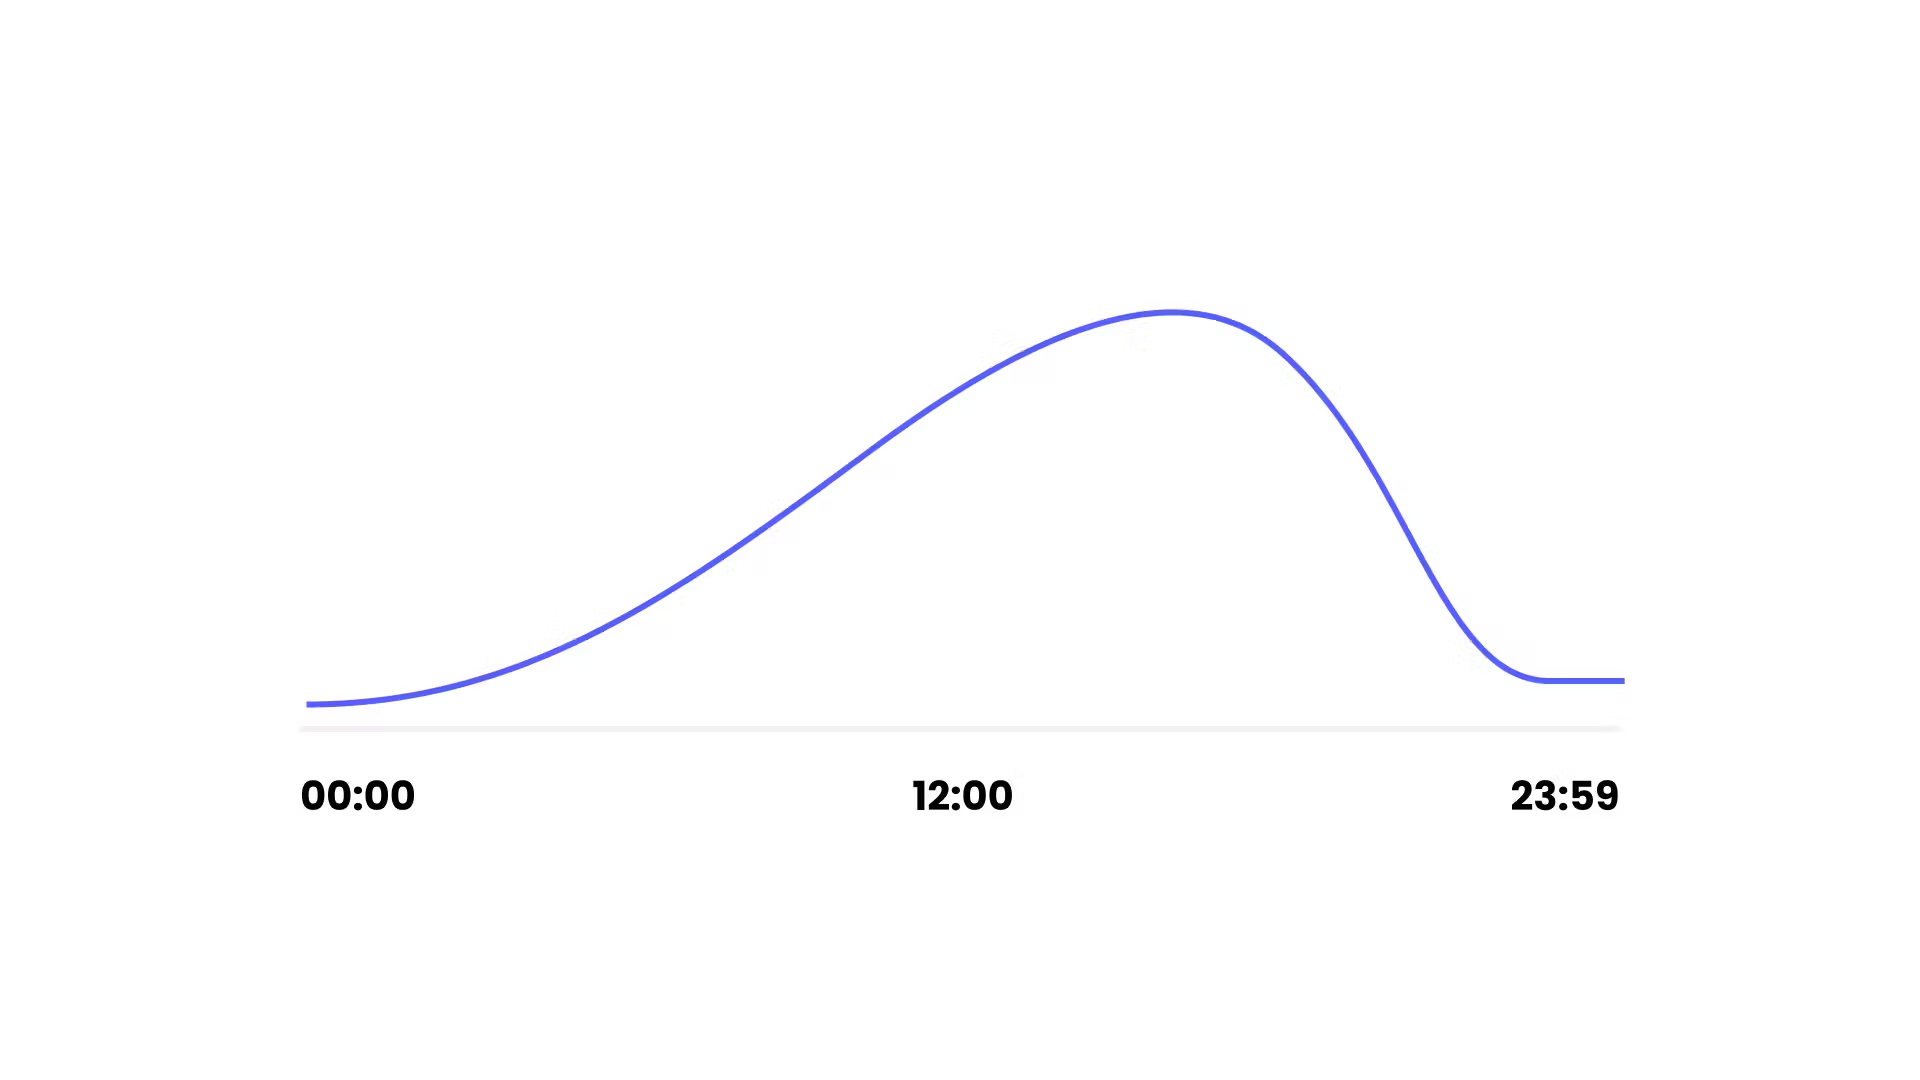
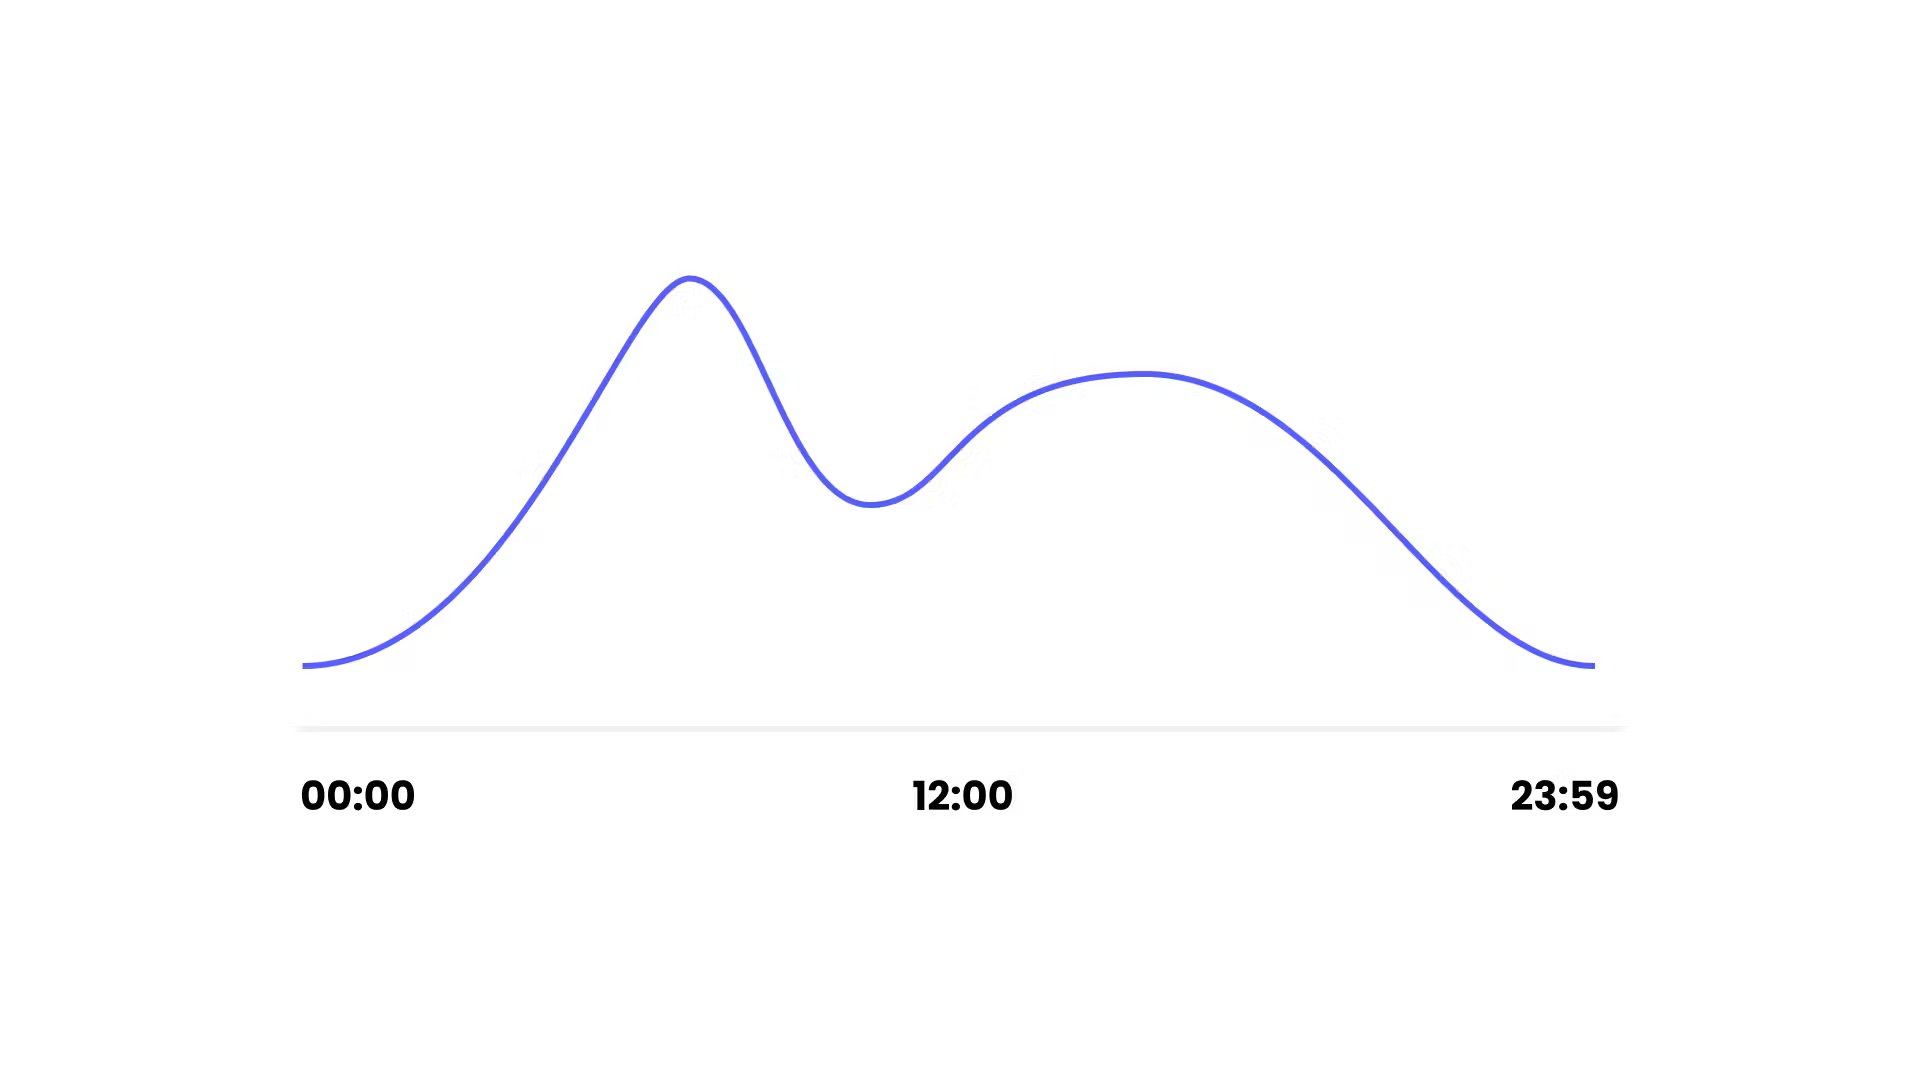
Are your users as likely to sign up during the night than during the day? On this chart we see that people tend to signup when they are awake.
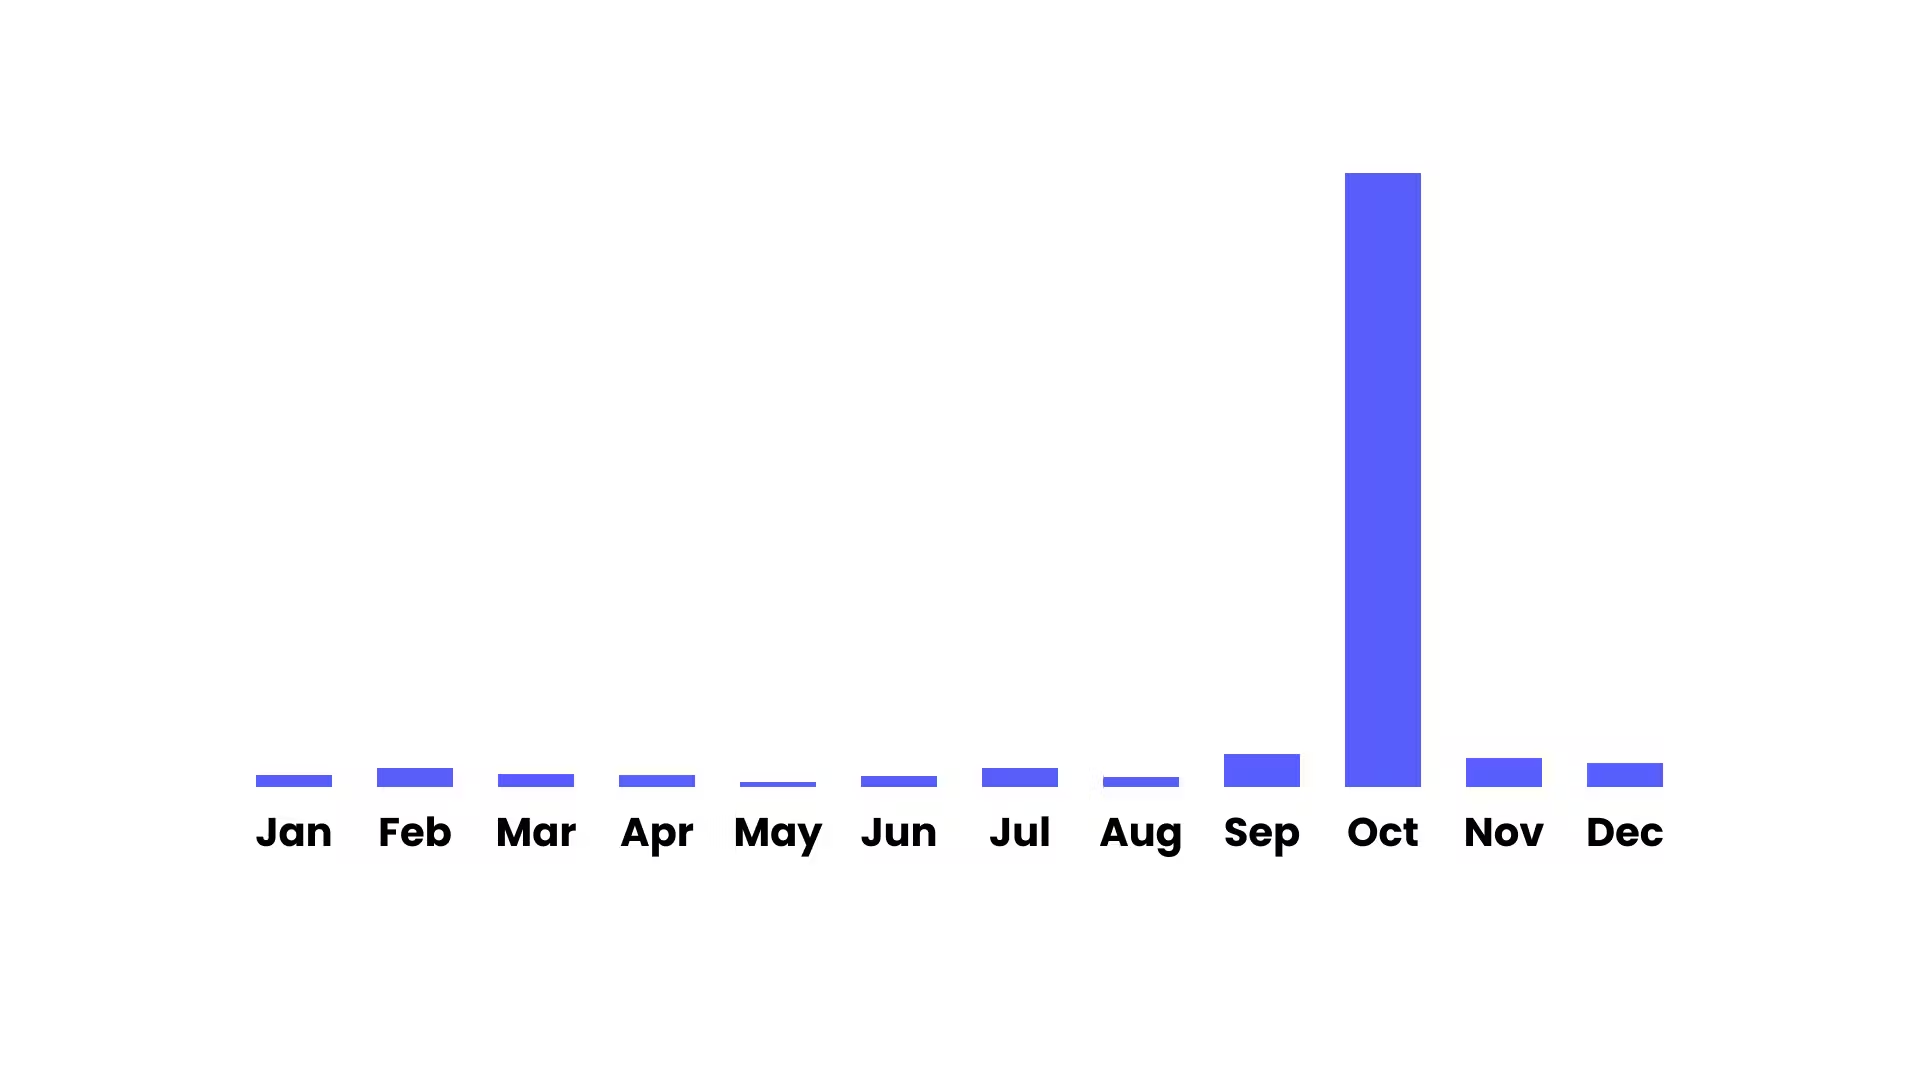
Are signups evenly distributed over the year or do you see spikes after a marketing push? Maybe if you sell Halloween costumes you'll see a significant spike in October as shown on this chart...
Maybe you operate in different timezones, this would end up comparing the behavior of people in Europe and America and draw generalized conclusions on the impact of a feature on your metric that might actually be more driven by cultural differences than anything else.
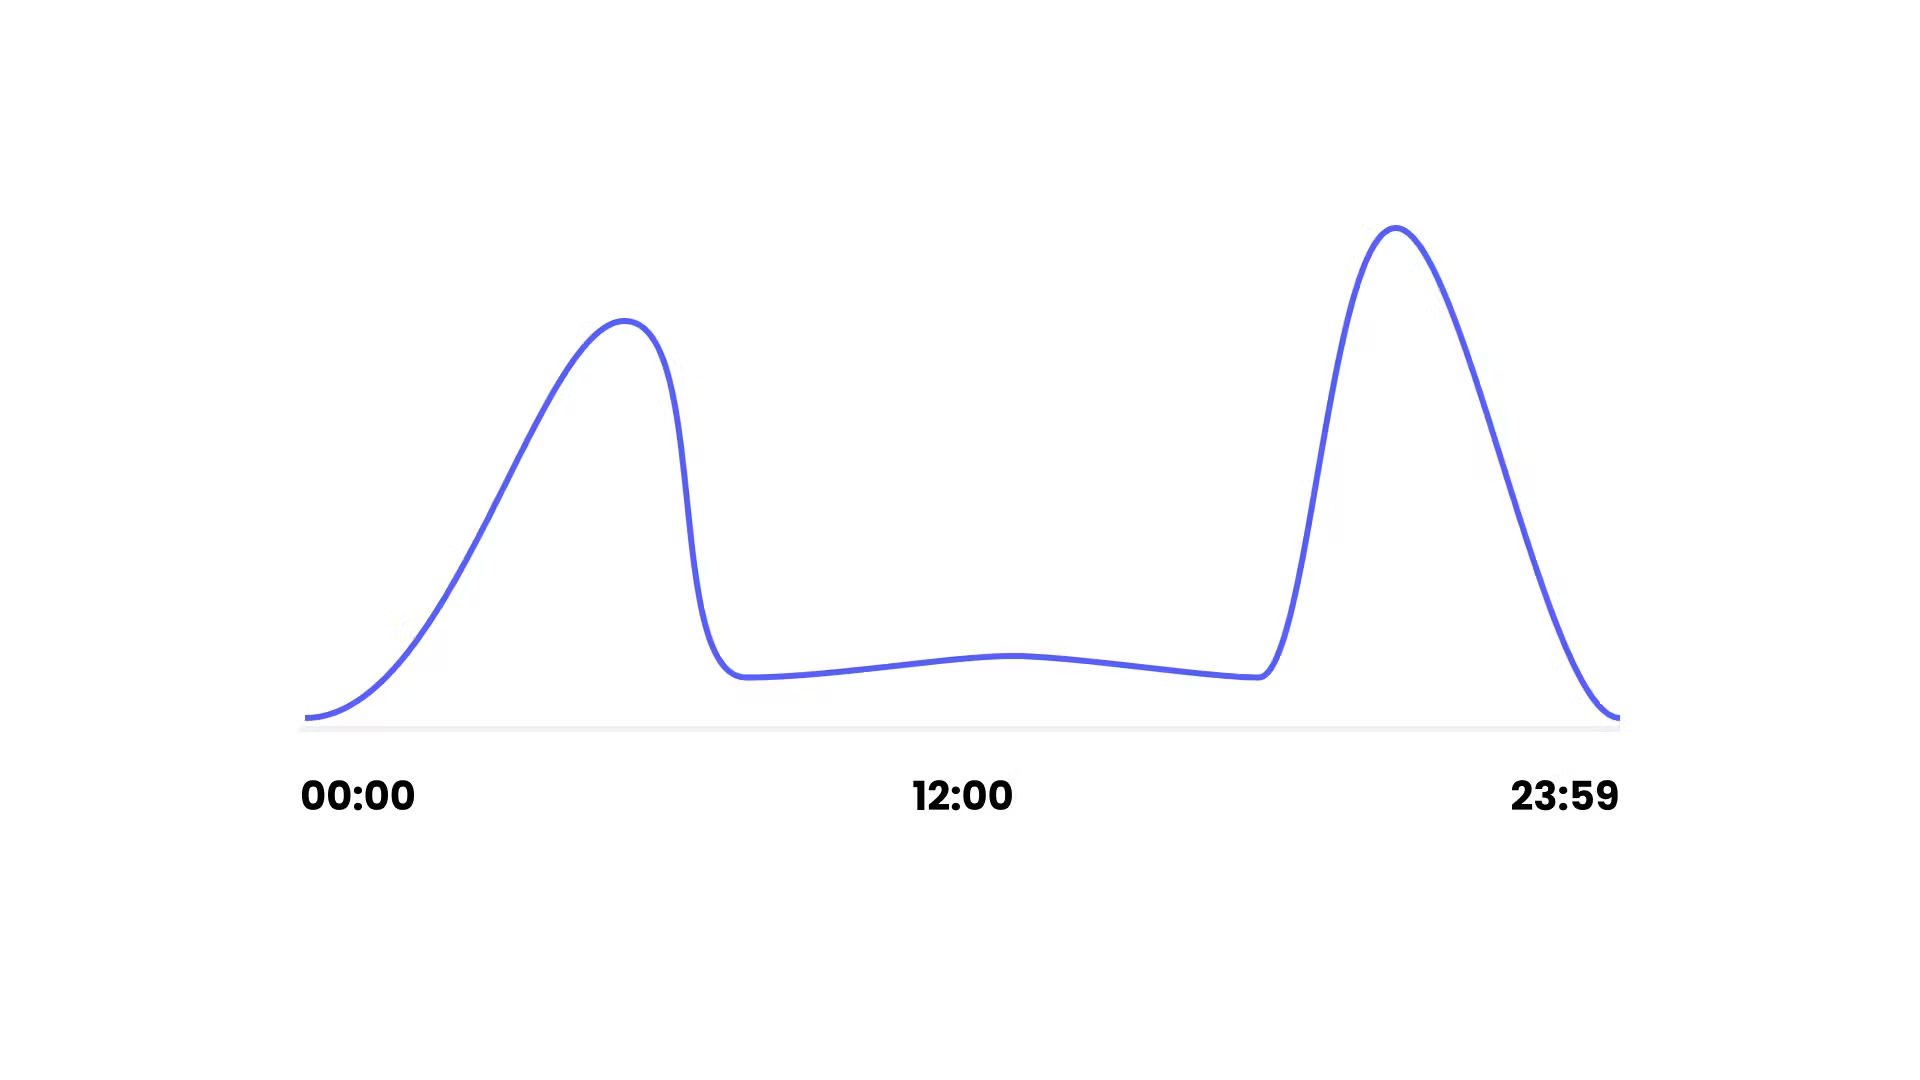
But you operate in a single timezone right? Maybe your candy-crush app is only used during commutes before and after work, making two big spikes.
What if you are building a running app, people who sign up early in the morning are probably a much different population than people who sign up after work. If you run an experiment based on this and variation A ends up having a better conversion rate, is it because variation A is better, or because the population who run in the morning is more likely to convert?
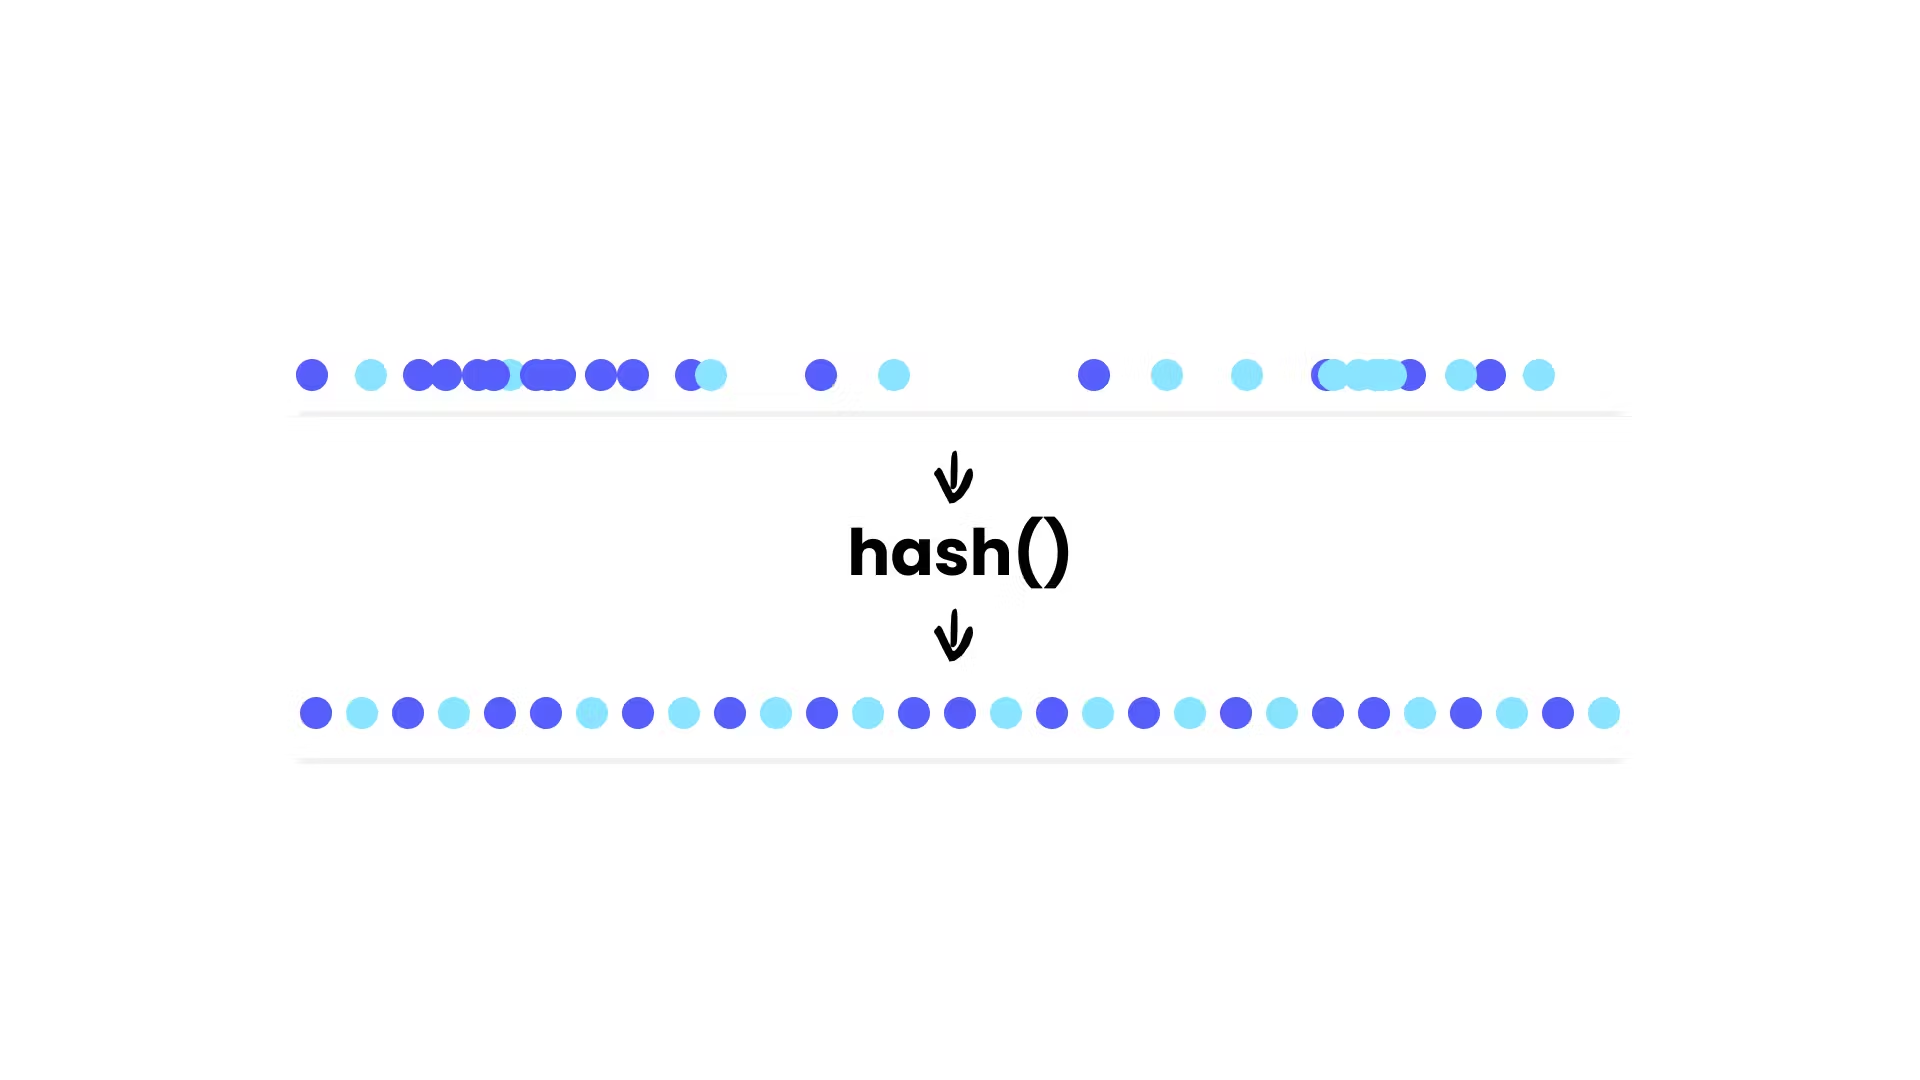
Because the underlying data might not be uniform, you always want to hash the value first. It is now a matter of choosing the right hash function that offers a uniform distribution of its output, and that runs fast enough (cryptographically secured hash functions like SHA1 are way too slow for this use case).
if (hash(userId) / 0xffffffff < 0.5) {
  // Variation A
} else {
  // Variation B
}
Hashing a value that is not evenly distributed will uniformly and randomly spread it across the domain, removing any clustering effect in the process.
Running simultaneous A/B tests
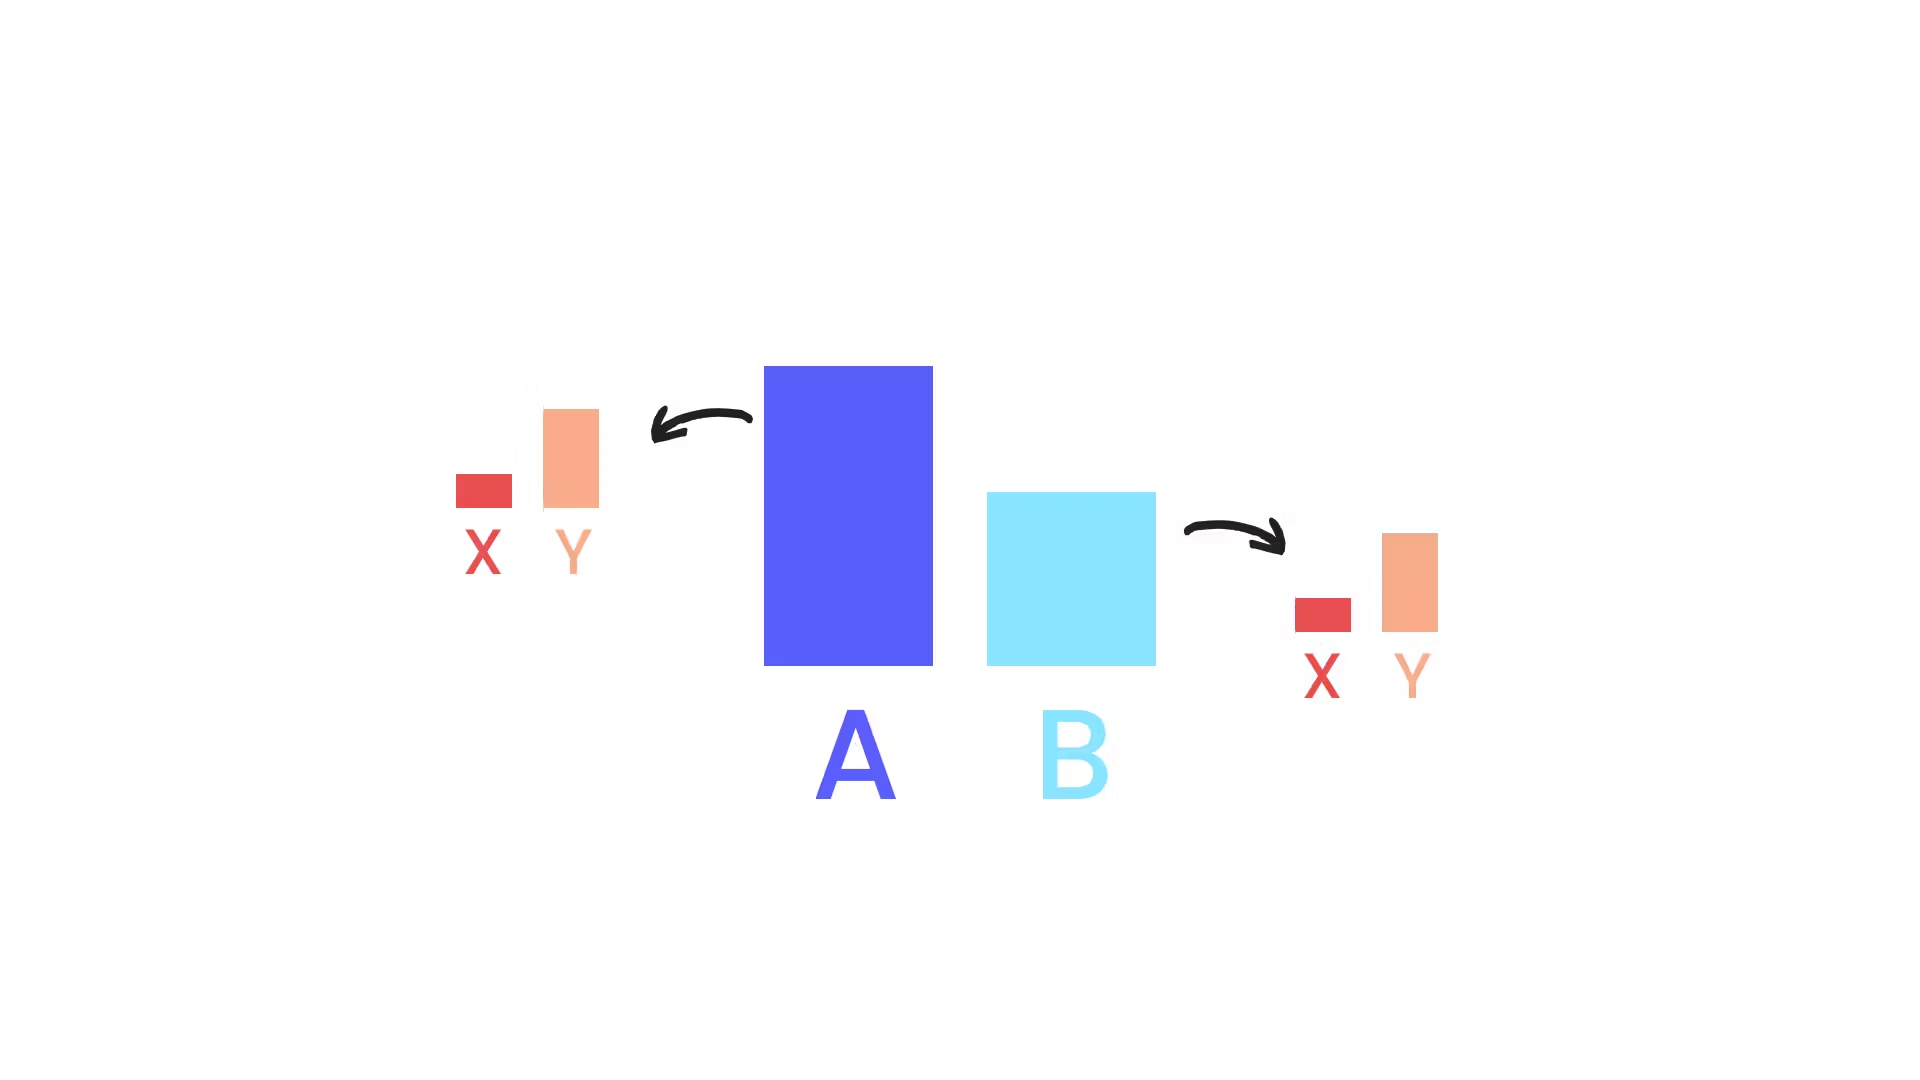
What happens if you decide to run multiple experiments at the same time? Let's assume you are running two, one for the signup flow (AB) and one for the checkout flow (XY), both at 50/50 of your users. Using the strategy we came up with in the previous section, a user who has an ID with a hash of 0.2 will see AX, and a user with a hash of 0.7 will see BY.
You can now compare the conversion rate (CR) on the signup flow based on which version of the first experiment each user saw. If users who saw variation A convert more, you know that you should keep version A of the first experiment.
But can you really be sure that version A of the first experiment had a positive impact on the CR? The difference in conversion rate seems to support this claim, but in reality, it could have absolutely no impact, the difference in CR may come from the second experiment. Because both experiments use the same population to test their hypothesis, there is no way to know the impact of each experiment individually.
In other words, the two experiments are correlated, half of your users see AX while the other half sees BY, and no one sees a mix of AY or BX:

In the de-correlated scenario, if users who see variation A have a better CR than variation B, we know that the second experiment cannot be responsible for that difference. How can we be sure? If the second experiment had any impact (positive or negative) it would have the same impact on both A and B, meaning that the difference you see is actually exclusively due to the first experiment.
In a scenario where the first experiment is split 30/70 and the second 20/80 we would have the following distribution:

We have 30% who see version A (6+24), out of which 20% see variation X (6/30). And 70% see variation B (14+56), out of which 20% see variation X (14/70).
The proportion of users who see a given variation of the second experiment is the same for variations A and B, meaning that our experiments are not biased by others.
To make sure every experiment is de-correlated you can add a different constant for each experiment:
if (hash(userId + experimentId) / 0xffffffff < 0.5) {
  // Variation A
} else {
  // Variation B
}
Doing so will ensure that the same user ID will not necessarily see the same variation for each experiment (even tho it might!).
Pitfalls and challenges of DIY A/B testing
Venturing into the world of A/B testing without the aid of specialized tools or expertise can be likened to navigating a minefield blindfolded. While the fundamental concept behind A/B testing is straightforward, its execution demands precision, foresight, and meticulous attention to detail. Below, we'll highlight some of the most common challenges and pitfalls that can be encountered in DIY A/B testing:
-
Inadequate sample size: Perhaps one of the most common mistakes in A/B testing is not collecting enough data. A test's conclusions are only as good as the sample size it's based on. Without a statistically significant sample size, any observed differences could simply be due to chance.
-
Ignoring seasonality: Running an A/B test during a seasonal sales spike, holiday, or other event can skew results. For instance, an e-commerce store testing a new layout during Black Friday might falsely attribute a spike in sales to the new design, when it's actually just the seasonality at play.
-
Data snooping: This refers to the habit of checking the results of an A/B test before it's complete. Early data might hint at a winner, but without the full dataset, these conclusions can be premature and misleading.
-
Variation overload: While it's tempting to test numerous variations simultaneously, it complicates the process and requires a much larger sample size for valid results. The more variations you have, the harder it becomes to pinpoint which specific change led to observed differences.
-
Not accounting for external factors: Events outside of your test—like a viral marketing campaign, PR crisis, or even a website outage—can impact user behaviour and skew your test results.
-
Over-reliance on historical data: Just because a particular design or feature worked in the past doesn't guarantee its future success. Markets, audiences, and trends evolve. Relying too heavily on historical data can blind you to new patterns and shifts in user behaviour.
-
Lengthy test duration: While it's essential to run a test long enough to collect sufficient data, dragging it out too long can introduce new variables that weren't present at the test's commencement, thereby compromising its integrity.
-
Overlooking the importance of a control group: Without a baseline (or control group) to compare against, it's impossible to measure the effectiveness of your changes. The control group provides a necessary point of reference against which the variant's performance can be gauged.
In essence, while A/B testing can provide invaluable insights, it's a delicate process that's riddled with potential pitfalls. Steering clear of these challenges requires a combination of expertise, the right tools, and a systematic approach. For startups and businesses eager to glean actionable insights from their A/B tests, it's often more efficient and reliable to leverage specialized tools or seek expert guidance.
How to choose an A/B testing tool
Choosing the right A/B testing tool can significantly influence the effectiveness and reliability of your tests. With numerous options available, it's crucial to assess various factors before settling on a tool. Here's what to consider:
-
Ease of use: Opt for a tool with a user-friendly interface, ensuring that tests can be set up and managed without an advanced technical background.
-
Integration with analytics platforms: A seamless integration with your existing analytics stack, like Amplitude or Mixpanel, is essential. This ensures you can delve deep into results using familiar tools, making the most of your existing infrastructure.
-
Advanced segmentation: Seek tools that allow targeting specific user segments based on criteria such as behaviour, location, or device. This granularity enhances the quality of your insights.
-
Real-time monitoring: Access to a real-time dashboard allows for continuous performance checks and adjustments, if necessary.
-
Broad integration capabilities: Your chosen tool should mesh well with other platforms you use, such as CRMs or marketing tools, to provide a holistic testing ecosystem.
-
Support for multi-variate testing: For those looking to run more complex tests with multiple variables, the tool should offer multi-variate testing capabilities.
-
Guardrails against common mistakes: Some tools offer safeguards against frequent A/B testing pitfalls, ensuring your tests run smoothly and accurately.
-
Pricing and scalability: Consider both your current budget and future growth. The tool should be affordable now but also scalable for evolving needs.
-
Training and support: Comprehensive documentation, training, and responsive customer support can make a significant difference in your testing journey.
In essence, while there are numerous A/B testing tools on the market, their capabilities vary. Weigh the above criteria against your specific needs to ensure you choose a tool that aligns with your testing goals, complements your technical infrastructure, and respects your budget.
Conclusion
A/B testing stands as a beacon of data-driven decision-making in the world of digital products. It's not just about flipping a coin and hoping for the best; it's a structured approach to discerning user preferences and behaviour. As we've discussed, the foundation of any successful A/B test lies in its setup, specifically in the precise splitting of traffic. Any lapses in this process can inadvertently lead to data contamination, resulting in skewed outcomes.
Moreover, while the principles of A/B testing remain consistent, the tools we use to implement these tests can differ greatly. Just as it's essential to understand the nuances of traffic splitting, it's equally crucial to select a tool that integrates seamlessly with your analytics infrastructure. This ensures not only the accurate collection of data but also its meaningful analysis using platforms you're already familiar with.
In conclusion, as the digital landscape continues to evolve, A/B testing will remain a cornerstone for companies striving to offer the best user experience. Whether you're a startup or a large corporation, understanding the depth of A/B testing and investing in the right tools will undoubtedly pave the way for more informed decisions, ultimately benefiting both your users and your bottom line.