How to set up an A/B test campaign using Amplitude

A/B testing is a powerful technique that allows you to experiment with different variations of your app or website to determine which version performs better. It helps you make data-driven decisions and optimize user experiences and key metrics.
While implementing A/B testing in-house can be complex and resource-intensive, there are cost-effective solutions, like Tggl, that provide flexibility and integration with popular analytics tools like Amplitude. By using Tggl in combination with Amplitude, you can set up and run A/B tests quickly and efficiently.
In this article, we'll guide you through the process of setting up an A/B test campaign using Amplitude and Tggl, so you can start optimizing your application and gathering valuable insights.
The Advantages of A/B Testing with Tggl and Amplitude
When it comes to running A/B tests, leveraging Tggl in combination with Amplitude offers several advantages that streamline the testing process and ensure seamless data tracking and analysis.
1. Centralized Data Tracking
By integrating Tggl with Amplitude, you can maintain all your data tracking in a single tool. This means you don't have to rely on multiple platforms or switch between different tools to monitor and analyze the performance of your A/B test. With Amplitude as the central hub, you can access all the necessary insights and metrics in one place, making it easier to draw accurate conclusions and make data-driven decisions.
2. Streamlined Experiment Management
Tggl provides a user-friendly interface for managing A/B test experiments. With just a few clicks, you can set up and customize variations, define traffic splits, and monitor the progress of your experiments. The seamless integration between Tggl and Amplitude ensures that the data from each variation is correctly attributed and recorded, making it simple to track the performance of different test groups and compare results.
3. Comprehensive Data Analysis
Amplitude offers robust analytics capabilities that empower you to dive deep into the results of your A/B tests. With advanced segmentation, funnels, and cohort analysis, you can examine how different variations impact user behavior, conversion rates, and key performance indicators. By leveraging Amplitude's powerful data visualization and reporting features, you can gain a comprehensive understanding of the impact of each variation and make informed decisions about which changes to implement permanently.
4. Real-Time Iteration
The integration between Tggl and Amplitude allows for real-time iteration and optimization of your A/B tests. As data flows into Amplitude, you can monitor the performance of each variation, identify any significant differences, and quickly iterate on your experiments. This enables you to make timely adjustments, implement winning variations, and continuously improve user experiences based on data-backed insights.
By combining Tggl's A/B testing capabilities with Amplitude's comprehensive data tracking and analysis features, you can streamline the entire A/B testing process, gain valuable insights, and make informed decisions without the need for separate tools or fragmented data.
Setting up your experiment
1. Splitting traffic
Splitting traffic effectively is crucial for conducting A/B tests. While you could build your own solution, leveraging a specialized tool like Tggl provides greater flexibility and ease of use. Tggl integrates seamlessly with Amplitude, making it an excellent choice for setting up A/B tests.
To get started, create an account on Tggl. Once you've created your account, navigate to the "Feature Flags" menu and click on "New". Choose the A/B test template to quickly set up your experiment. By default, the template splits traffic among three groups: 20% for variation A, 20% for variation B, and the remaining 60% for the control group.
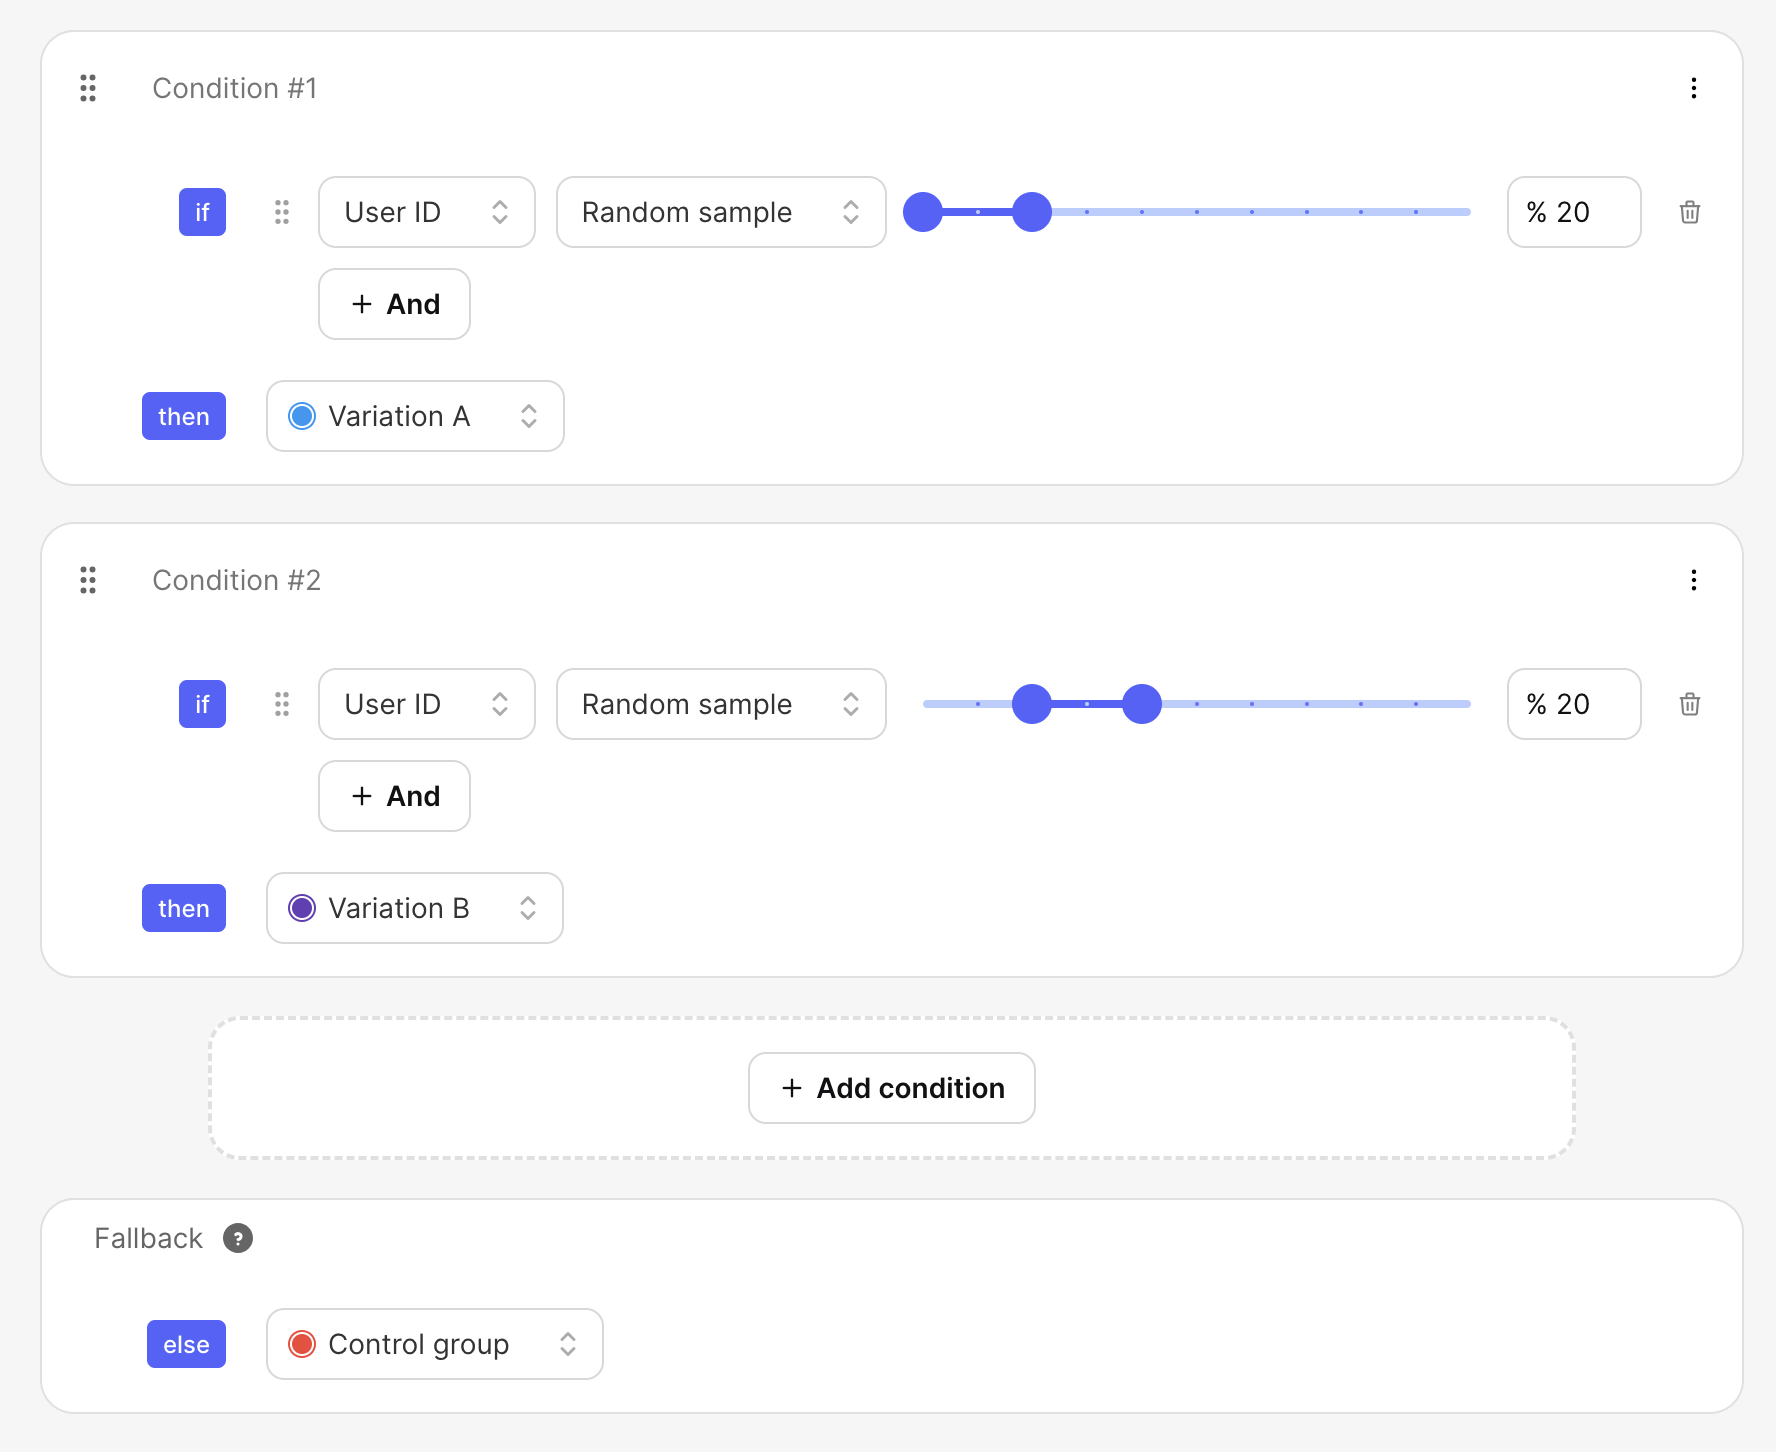
For our example, let's say we want to test the impact of changing the color of the "Pay Now" button on the checkout page. Variation A will have a red button, variation B will have a green button, and the control group will see the default blue button.
You can customize the variations and their proportions based on your specific needs and goals. Here we will rename them and give them more meaningful values:

Once you implement the different variations in the code, any change your product team will make here will immediately impact your app without the need for an engineer's intervention. Tggl empowers non-technical teams by giving them the tools needed to conduct experiments autonomously.
2. Integrating Tggl and Amplitude
To get started we will need to integrate both tools into the codebase to have them automatically track events that we can then analyze. The setup has to be done once, making subsequent experiments trivial to set up.
We'll use the React framework in this guide, but you can adapt the examples to other platforms as well. To begin, install the Amplitude and Tggl SDKs using npm:
npm i react-tggl-client @amplitude/analytics-browserNext, add the following code snippet to your App component to initialize Amplitude and Tggl and have them track events automatically.
import * as amplitude from '@amplitude/analytics-browser'
import { TgglClient, TgglProvider } from 'react-tggl-client'

amplitude.init('<AMPLITUDE_KEY>', undefined, {
  defaultTracking: {
    pageViews: { trackHistoryChanges: 'all' },
  },
})

const client = new TgglClient('<TGGL_KEY>')

function App() {
  return (
    <TgglProvider client={client}>
      {/*...*/}
    </TgglProvider>
  )
}
To inform Tggl about the current user's ID and split traffic accordingly, you can call the updateContext function returned by the useTggl hook:
import { useTggl } from 'react-tggl-client'

const MyComponent = () => {
  const { user } = useAuth()
  const { updateContext } = useTggl()

  useEffect(() => {
    if (user) {
      updateContext({ userId: user.id })
    } else {
      updateContext({ userId: null })
    }
  }, [user])

  return <></>
}
This ensures that Tggl assigns the same variation to a user across multiple sessions. With the integration complete, you're ready to move on to the next step.
3. Implementing the different variations
Now that you have set up the necessary integrations, you can start running your A/B test.
Implementing the different variations we set up earlier can be done easily using the useFlag hook. Any change made on the Tggl dashboard will immediately impact your app without needing to update code or trigger a deployment.
import { useFlag } from 'react-tggl-client'

const MyButton = () => {
  // We set the default value 'blue' for the control group
  const { value } = useFlag('myFlag', 'blue')

  return <BaseButton color={value} />
}
Amplitude will automatically track every page change, which is perfect for tracking people who arrive on the checkout page. But for tracking people who actually click on the "Pay Now" button we need to manually call the track method:
import * as amplitude from '@amplitude/analytics-browser'

const Button = () => {
  return (
    <button onClick={() => amplitude.track('Click Pay')}>
      Checkout
    </button>
  )
}
With only a few lines of code, you can delegate the responsibility of splitting traffic to a non-technical team and automatically track all the events needed to conduct an A/B test. We can now jump into Amplitude to create our charts.
4. Tracking A/B test results with Amplitude
We are now going to create a chart in Amplitude to display the improvement in conversion rate between our variations.
From your Amplitude dashboard, hit the "Create New" button and choose Analysis > Funnel. From there, in the "Events" panel on the left of the page, you need to add all the events of the funnel you wish to track. In our case, we have two:
-
First, the user must land on the
/checkoutpage. Add a "Page Viewed" event and click "Filter by" to add a filter on the event property "Page Path". This ensures we only count users landing on the/checkoutpage. -
From there, we want to track the conversion rate to the "Click Pay" event that we manually tracked from our code.

You should now see a chart of the 2-step funnel with the global conversion rate displayed at the top, we can now display the improvement between the control group and the two variations. In the "Measured as" section just below, select "Improvement".
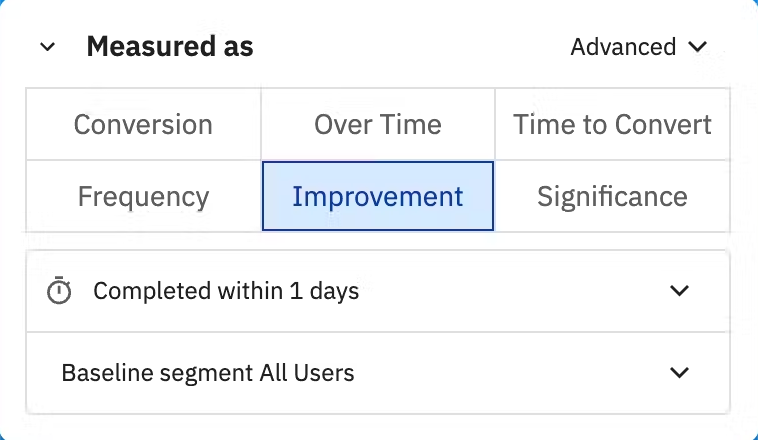
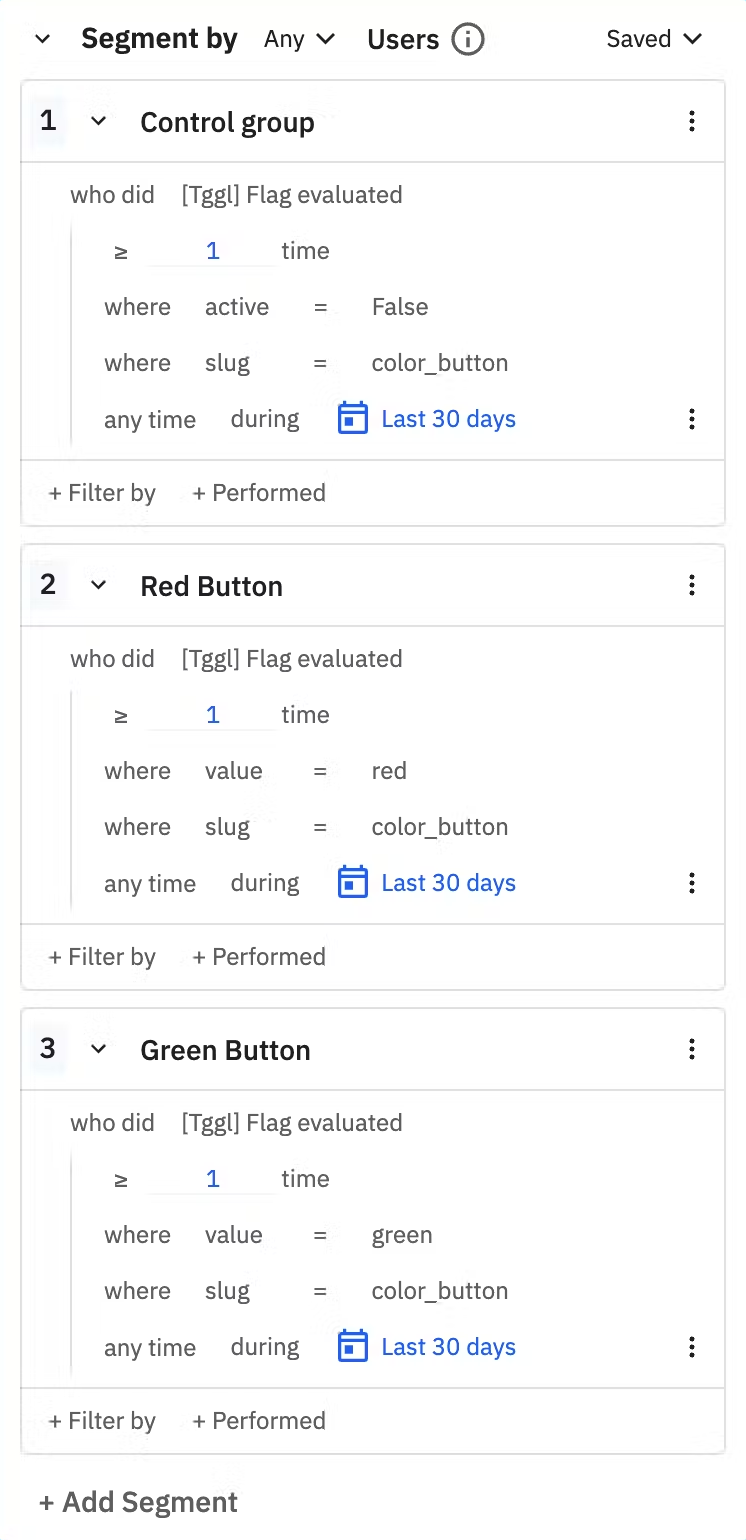
Now we need to group our users into three segments in the "Segment by" section. We will be able to compare the CR of each segment and determine which variation is best for our business.
-
First, we have our control group. This segment represents all users for whom the flag is not active, they see the blue button. Click on "Performed" and select the "[Tggl] Flag evaluated" event. Then click on the filter icon next to the event you just added to filter the properties "active" and "slug" of the event so we only get users who evaluated the
color_buttonflag and got the inactive variation. (see image below) -
Then we have the red button segment, those users see the red variation. Here we select only users who evaluated the
color_buttonflag and got a value ofred. Notice that there is no need to add a filter on the "active" property because if the flag was not active, we would not have a value ofredin the first place. -
Finally, the green button segment is exactly like the red button segment, but with a different "value".
You should see a chart showing the improvement in conversion rate between the red and green segments compared to our control group. Now you simply need to wait for your users to use the app and for the data to arrive!
Analyzing Results and Making Data-Driven Decisions

From the table below the chart, you can see the volumes for each variation, here 5 users saw the green button, out of which 3 clicked on "Pay Now" which gives us a CR of 60%. Of course, the low volume that we have here does not give us accurate results, as pointed out by the warning message at the top of the chart, we would need to wait longer for more users to participate in the experiment.
Based on our test data we can see that the red button is reducing our CR by 33% while the green one is increasing it by 20%. In a real-world example, differences will probably not be that extreme, but the way to interpret the data is still going to be similar.
After running your A/B test for a sufficient period and gathering enough data, you can analyze the results in Amplitude. Based on the insights gathered, you can make informed decisions about which variation to implement permanently or iterate further on your experiment. Remember to consider statistical significance and sample size when drawing conclusions from your A/B test results.
Use our free A/B test calculatorto instantly see if your A/B testing results are significant & explore what happens as you adjust user volumes, conversion rates, and confidence levels!
Conclusion
A/B testing using tools like Tggl and Amplitude empowers you to optimize your application based on data-driven decisions. By splitting traffic and running experiments, you can gather insights and make informed changes to your app or website, leading to improved user experiences and business outcomes.
Start harnessing the power of A/B testing and experimentation to continuously improve your products and delight your users!
Happy testing!
