A/B testing
Overview
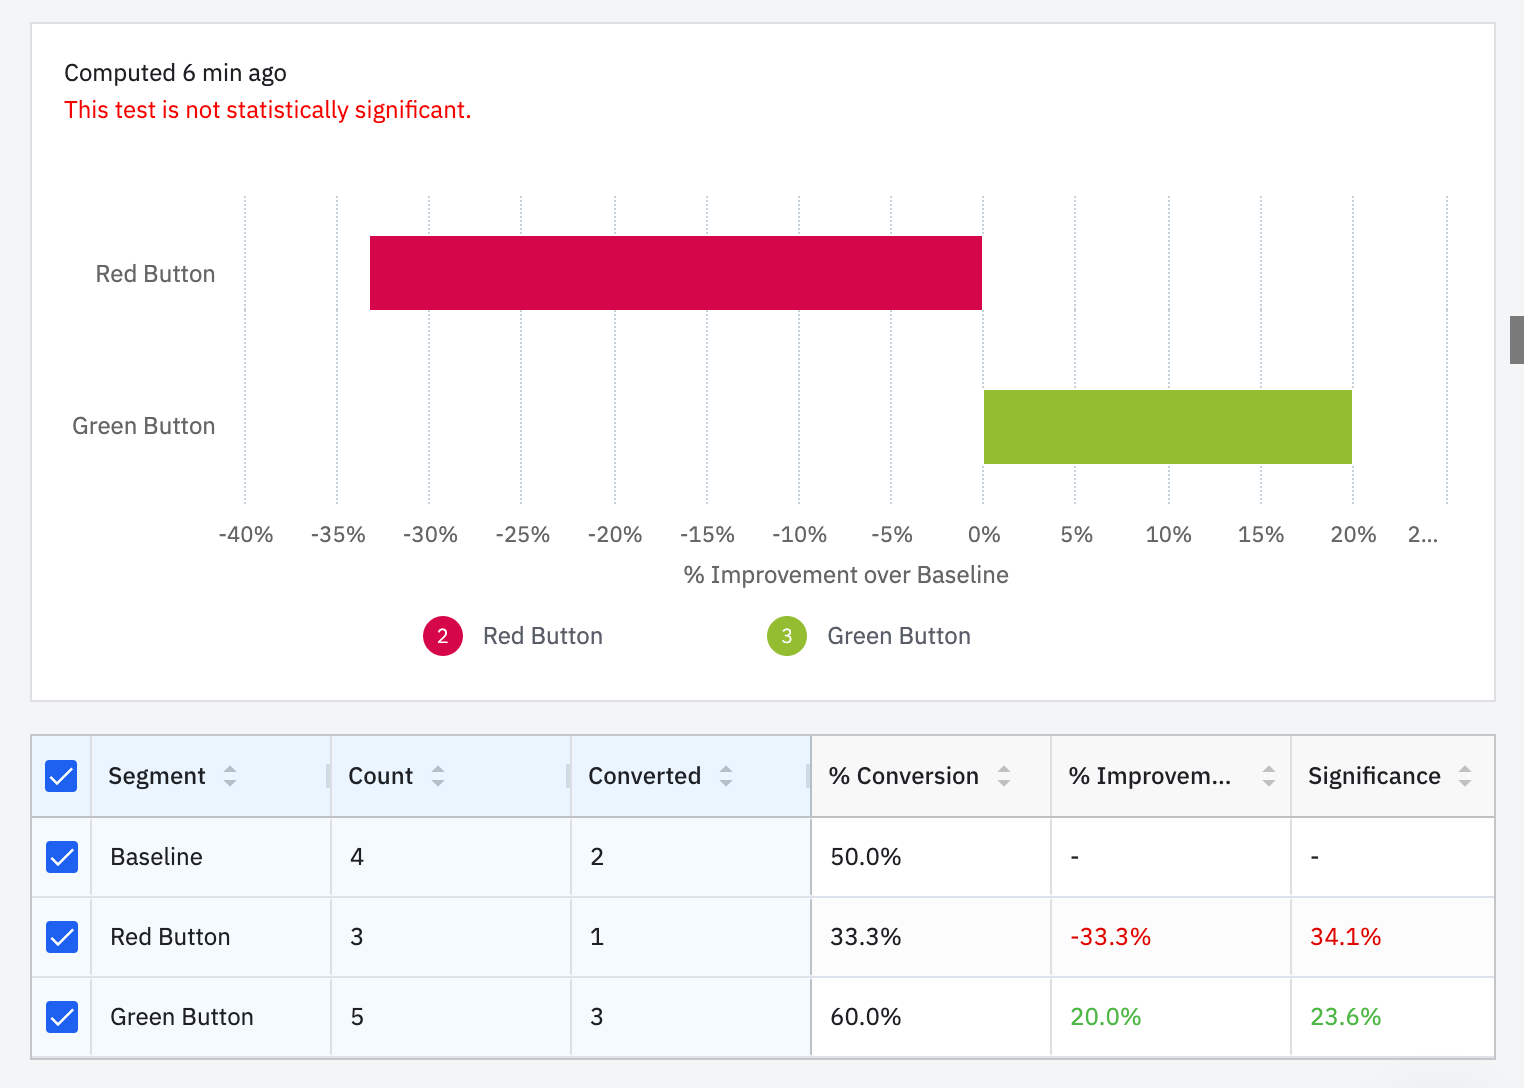
A/B testing allows you to assess and optimize the user experience and key metrics of your application. It involves comparing two or more variations of a particular feature, design, or functionality to determine which one yields better results.
Users are randomly divided into two or more groups and exposed to a different version of the feature being tested. This could include changes to the user interface, navigation flow, button placement, color schemes, or even algorithms. By collecting and analyzing conversion rates you can measure the impact of these variations on your business metrics.
For a complete step-by-step example on how to run an experiment with Tggl and Amplitude, check out our blog post.
Plugin Tggl to your analytics tool
Tggl provides seamless integration with Amplitude, allowing automatic tracking of all events related to flag evaluations. These events are then conveniently reported to your dashboard for easy monitoring and analysis. Read more about the Amplitude integration.
Tggl works nicely with your already existing analytics tool. You can track all flag evaluation events in one place and forward it to your analytics to compute conversion rates for A/B testing. This way you do not need to switch between applications or change your existing processes to get the full picture.
If you are using React, refer to the React SDK documentation to learn how to track flags evaluation events.
Managing different variations
A/B testing is about testing at least two variations, but with Tggl you are not limited to only two and can add as many as needed.
To differentiate all variations you need to add a value to each, here we added the hex color code of the variation as a string value:
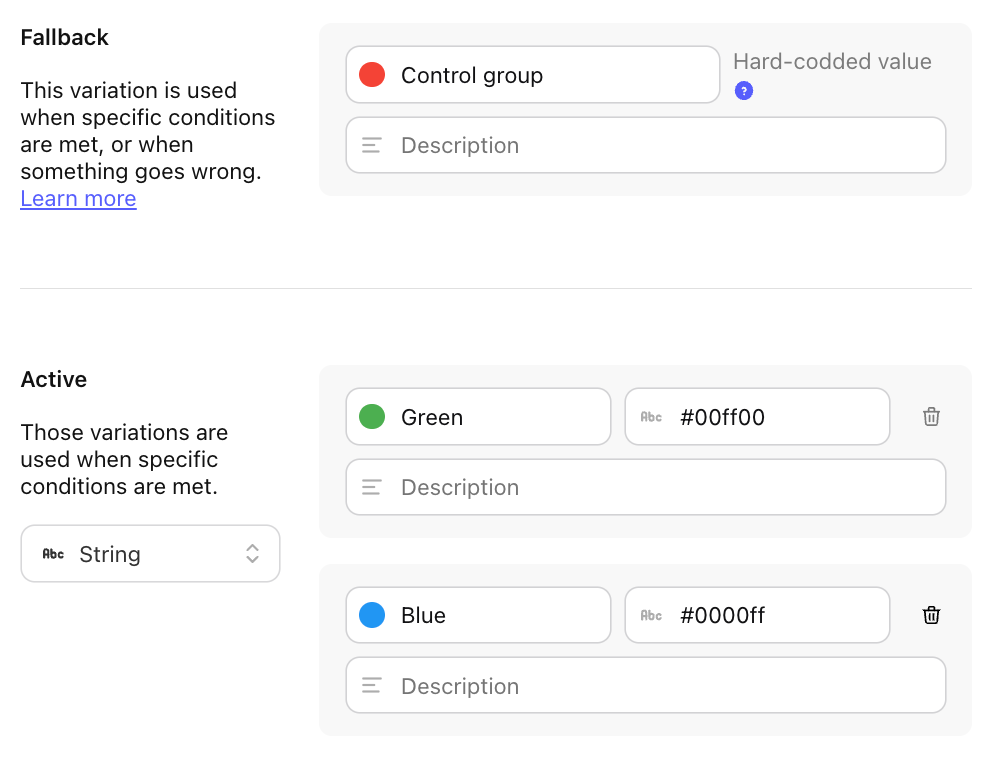
From your code you can now retrieve that value and use it to render the right version of your feature. Notice that if the user is in the control group, the value will be null, it is up to the developer to handle this case by adding a default value in the code:
const value = client.get('my-flag', '#f00') // Fallback to red

<Button color={value}>
  Pay Now
</Button>
Splitting traffic
Randomly splitting traffic between variations is a key component of A/B testing. It allows you to compare the performance of different variations and determine which one is the most effective.
Traffic allocation does not have to be equal, you may want to test risky changes on a small portion of your users only. In an experiment with two variations and a control group, we may want to allocate traffic like so:
- Green variation: 20%
- Blue variation: 30%
- Control group: 50%
When creating a flag you can choose the "A/B test" template to save time, and then set the traffic allocation for each variation:
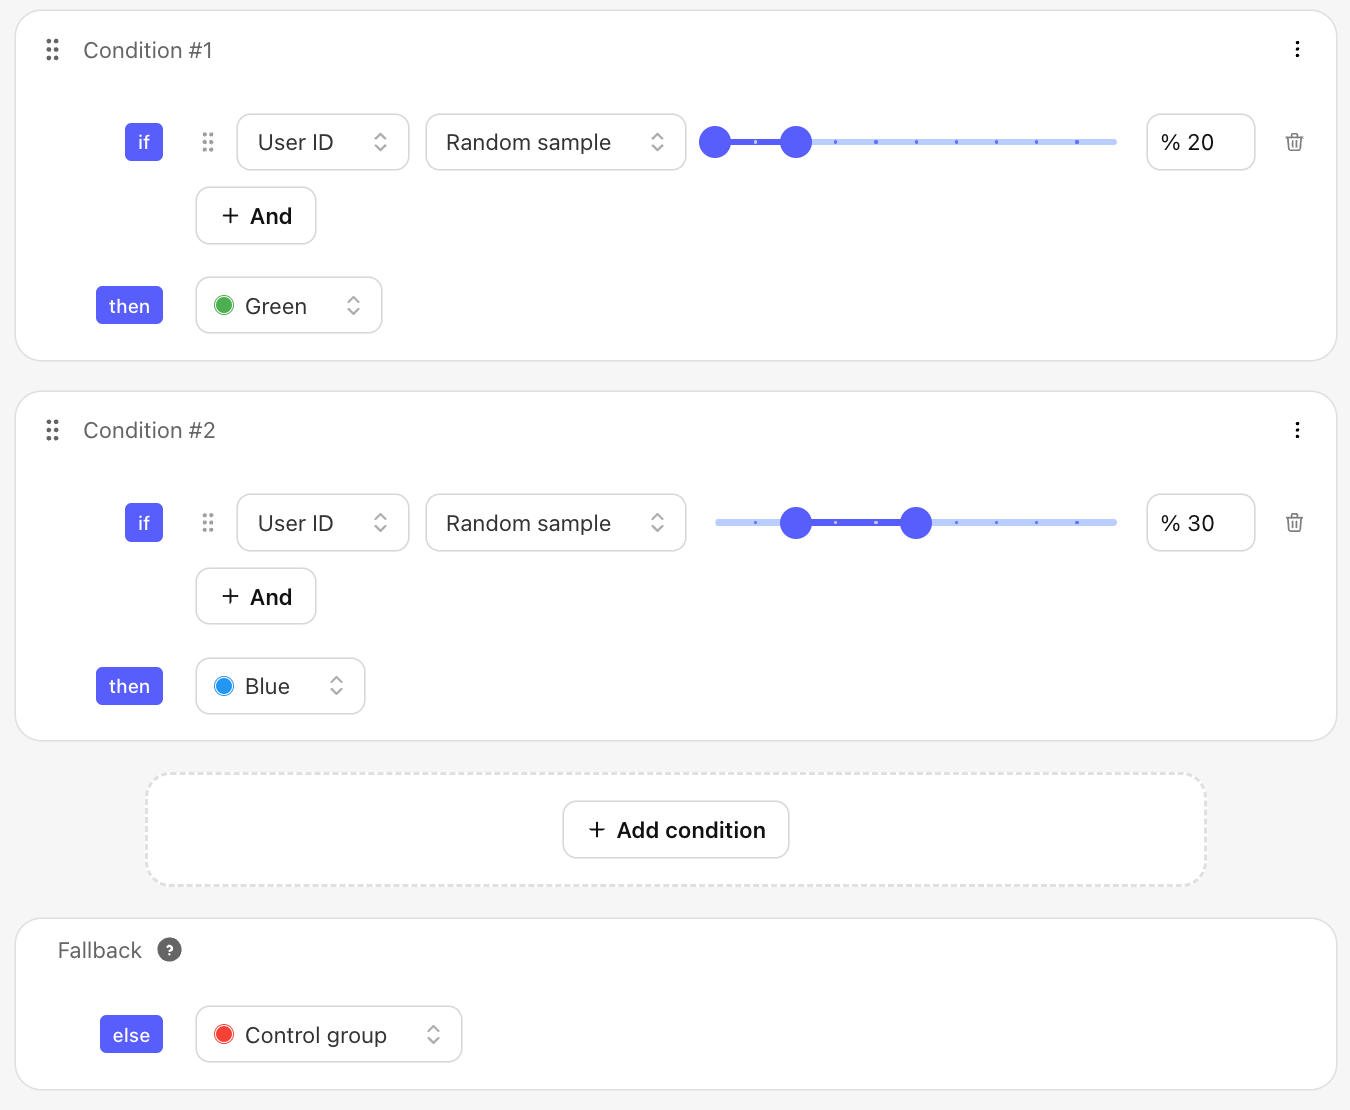
Notice that the 30% of the blue variation goes from 20% to 50% on the slider, which is much different than going from 0% to 30%. Doing so would have relusted actually only having 10% of users since out of the 30% you are targeting, the first 20% are already in the green variation.
You want to instantly see if your A/B testing results are significant & explore what happens as you adjust user volumes, conversion rates, and confidence levels?
Gain intuitive understanding of your results with our free A/B test calculator!